Radar Analysis
A primary radar measures bearing and distance to objects, while secondary radar additionally receives identification numbers and altitude measurements from the aircraft's transponder. The tracker in the radar system filters out noise from the measurements, follows aircraft over time, and calculates the aircraft's speed and heading. In 1989, some radar stations were still analogue, while others had transitioned to digital technology. Data analysis from an analogue radar system typically had to be done by observing the radar data on a screen, while the digital systems also made it possible to export the data as numerical values.
Different radars have different precision in their measurements, depending on the distance between the radar station and the aircraft. The radar systems at both Mågerø and Skagen consisted of multiple radar heads with primary, secondary, and a dedicated height-finding radar. Data from all the radar heads was collated by the tracker and formed the basis for the printouts. Noise in the radar data has already been filtered out, and the collation of data from multiple radar heads provides measurements with relatively high precision.
To be able to use radar data to establish exactly where two aircraft were in relation to each other, multiple complete, correlating datasets from objective sources are needed. In this case, the Armed Forces are not an objective source, and there is therefore a need to scrutinise the radar data with particular care and to use other sources to verify it. Radar data from Sweden could not be used to establish exact distance, because at the point of passing, the aircraft were so close that the points merged on the radar screen and were therefore not recorded in the footage.
Apart from the sketches delivered by the Swedish Armed Forces, it appears that only the Armed Forces/NATO delivered radar data to the accident investigation board. The radar data has major errors and deficiencies, particularly regarding the movements of the F-16 aircraft, and shows physically impossible situations. The only thing that can be established with certainty is that radar data has been altered after recording, and it is therefore not possible to use it as evidence for where the aircraft were in relation to each other.
Data Basis
Mågerø, Skagen, and AWACS were all connected in NATO's radar network (NATINADS) and continuously exchanged radar data with one another. Radar operators could see radar data from a number of stations on their screens, and these radar data were stored on tape for later playback.
The accident investigation board has had access to printouts from Mågerø, Skagen, and AWACS. Sweden delivered sketches of the Partnair and F-16 aircraft tracks, but these were based on photographic recordings of the radar screen every 40 seconds and contained no altitude information. A track based on 40-second intervals will not be able to register frequent heading changes, and the tracks will potentially show a straighter line than the aircraft's actual movements.
On Danish civilian radar (Aalborg and Copenhagen), a stationary object was observed after the accident. This coincides with the observations from Swedish radar, which the accident investigation board has established originate from parts of the aircraft drifting eastward with the wind.
The entire flight of the F-16, Partnair, and Braathens aircraft was registered by the radars at Mågerø, Skagen, and AWACS. Given that Mågerø and Skagen each had two radar heads with rotation periods of 10 and 12 seconds respectively, the aircraft were registered every 5–6 seconds by each station. There are many hundreds of data points for each of the aircraft in NATO's radar datasets, but only a small fraction of this has been delivered.
The quality of the radar data is very low. The AWACS printout shows positions with built-in uncertainty that produces a "zigzag track." There are large quantities of blank or static values in the data from Mågerø and Skagen. There is a lack of consistency between the two stations, but even within each individual dataset there are inconsistent values.
Data printouts from all available radar stations should have been presented to the accident investigation board immediately after the accident. Since radar data is in practice merely an export of measurements made by a radar system, nothing more than this data export should have been required. In connection with the Partnair accident, radar data with a series of errors has been presented, and some of the datasets have been presented in multiple versions—something that should have been entirely unnecessary.
Data Printouts from Mågerø and Skagen
The most contemporaneous radar data from Mågerø and Skagen dates from shortly after the accident. On 13 September, radar data was transmitted from Mågerø to the accident investigation board, but this consists of only a few points with coordinates and timestamps.
(Neråsen, 13.09.1989, p. 3) |
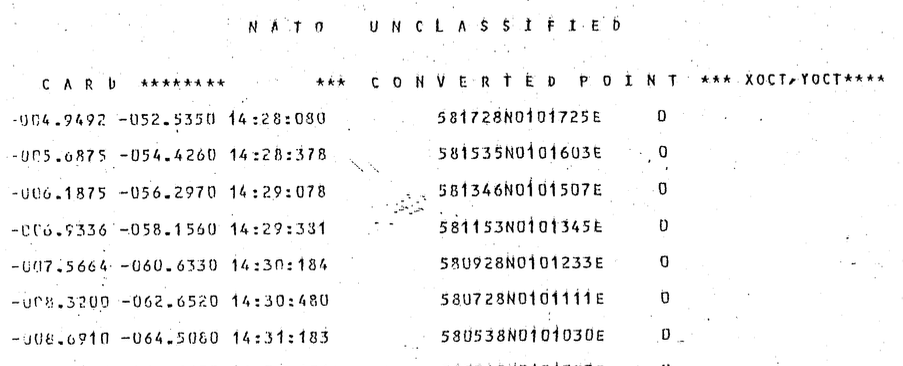
The radar data that Neråsen sent to the accident investigation board apparently originates from the Mågerø printout, since the timestamps and coordinates are identical. It is worth noting that only every third point for the Partnair aircraft was included in Neråsen's transmission—only position and timestamp—so it is natural to question whether this really was «all data that the Air Force Station Måkerøy can contribute.» (Neråsen, 1989, 13 September, p. 1)
Partnair at approximately 10-second intervals in the Mågerø dataset. |
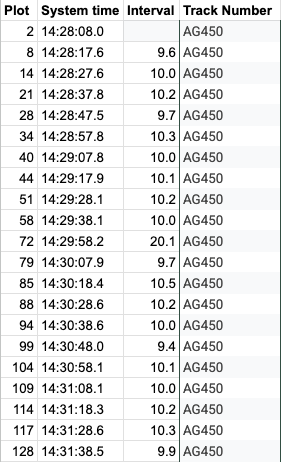
In Neråsen's cover letter, it also states: «Please note that all data is based on information that is automatically transferred from Danish radar to Lstn Måkerøy. The sortie has track number AG 450 in our computer.» (Neråsen, 1989, 13 September, p. 1)
This cannot be correct, since the Skagen radar had 12-second intervals, while the radar heads at Mågerø took 10 seconds per revolution.
On 19 September, Neråsen transmitted additional radar data from the Mågerø dataset. In the cover letter, it states: «As the appendix shows, only one – 1 – aircraft movement in the vicinity of the accident site has been registered. It is Braathens SAFE BRA 405 from ENFB to EKBI.» (Neråsen, 1989, 19 September, p. 1)
Only after VG revealed that there was an F-16 in the air over the Skagerrak did Neråsen transmit radar data showing the F-16:
«Hereby transmitted is the plotted track for PARTNAIR's aircraft and the F-16 on the opposite heading.» (Neråsen, 1989, 27 September, p. 1)
The F-16 pilot submitted his report to the accident investigation board on 28 September, the day after Neråsen sent the radar data.
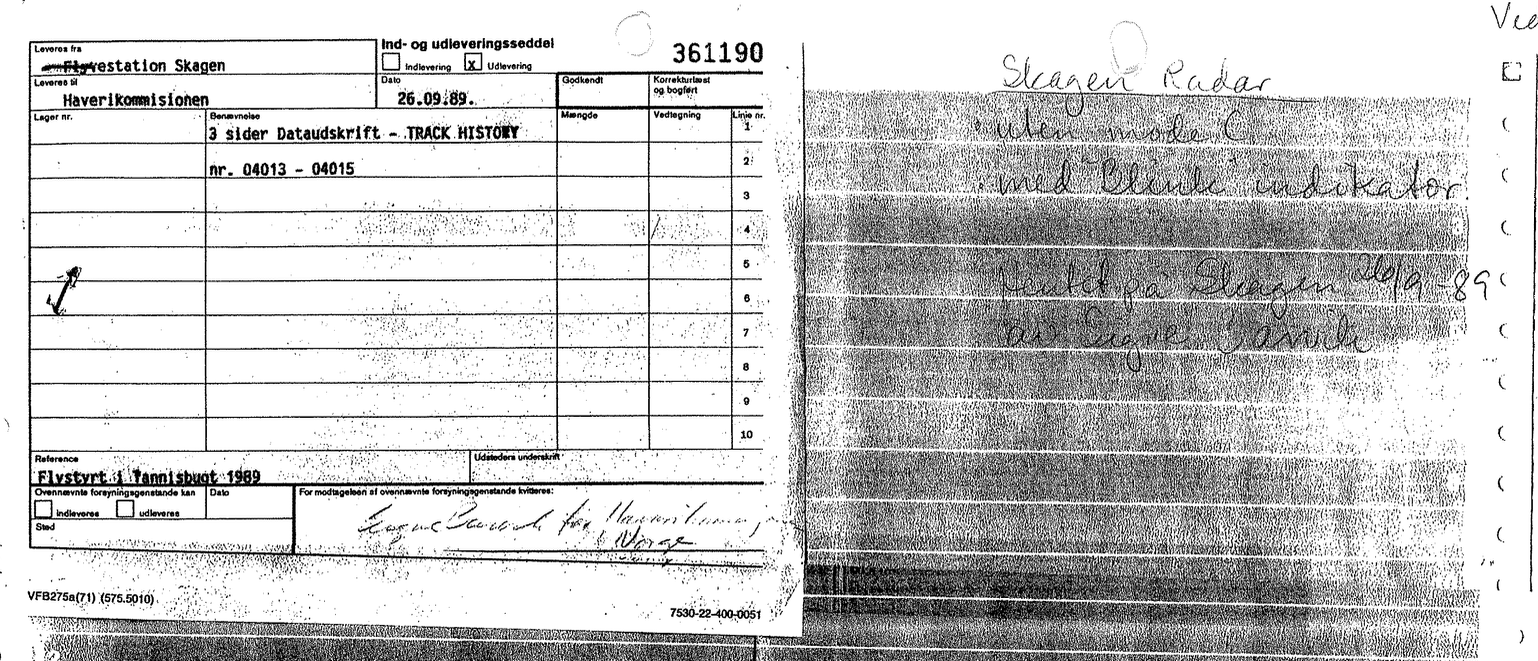
The data printout from Skagen radar was collected at Flyvestation Skagen on 26 September 1989 by Sigve Barvik, on behalf of the Norwegian accident investigation board.
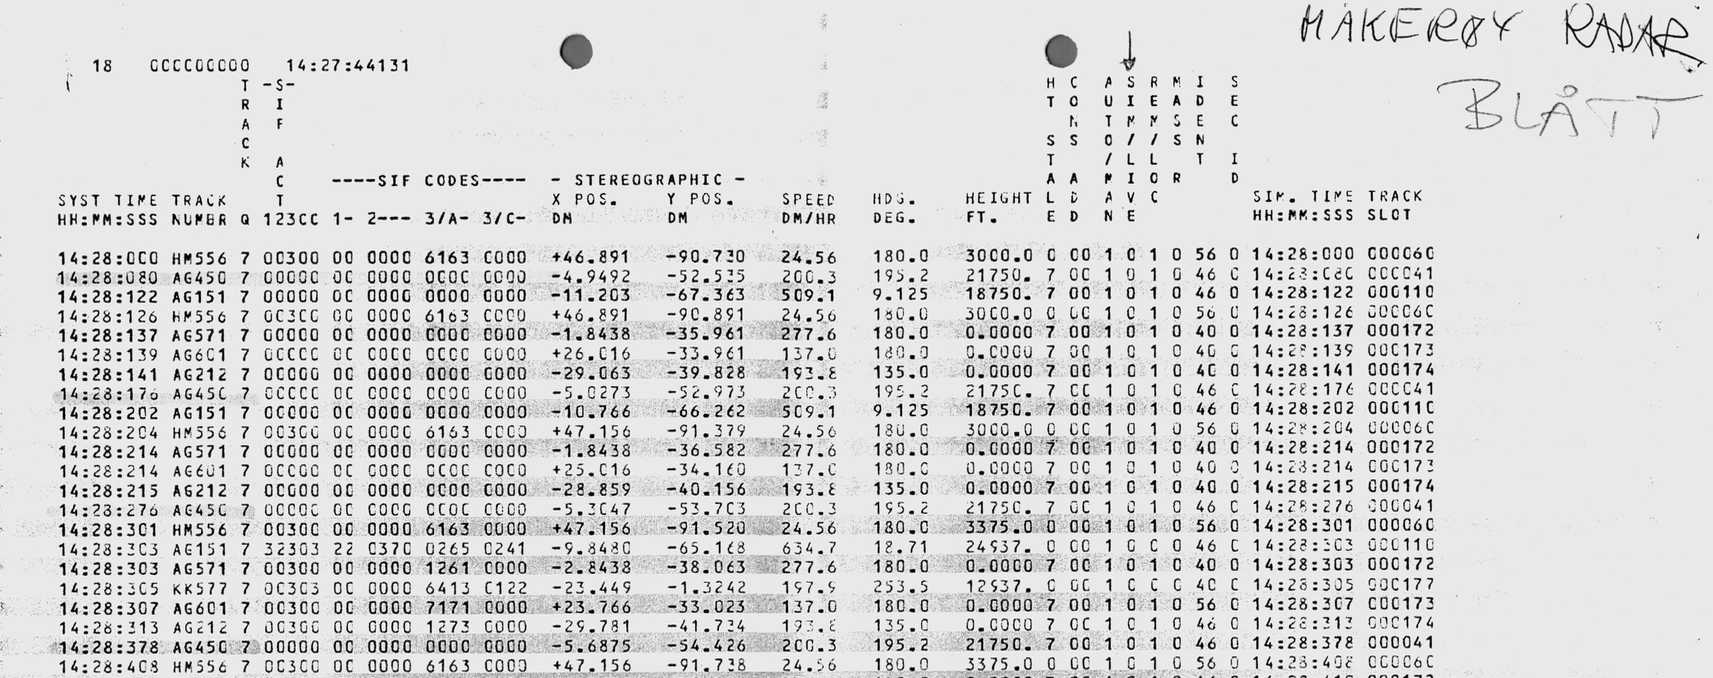
Data printout from Mågerø, September 1989. |
The data printout from Skagen radar was collected at "Flyvestation Skagen" on 26.09.1989, by Sigve Barvik, on behalf of the Norwegian accident investigation board. |
Source of Radar Data
That the F-16 radar data delivered from Mågerø in September 1989 originates from Skagen radar is an essential detail. The registrations made by the radar heads at Skagen were transferred via NATINADS to Mågerø. If one compares printouts with F-16 data from Skagen and Mågerø, each individual registration must be identical. This is not the case—none of the registrations are identical. There are two possible reasons: the data originates from other radar sources, or it is wholly or partially synthetic.
F-16 at approximately 12-second intervals in the Mågerø dataset (cannot originate from the radar heads at Mågerø). |
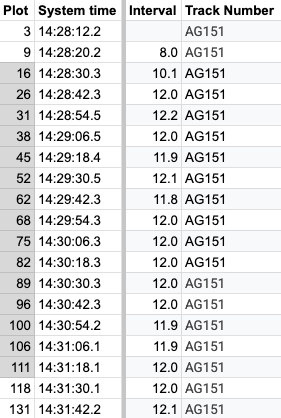
Static Values for the Partnair Aircraft
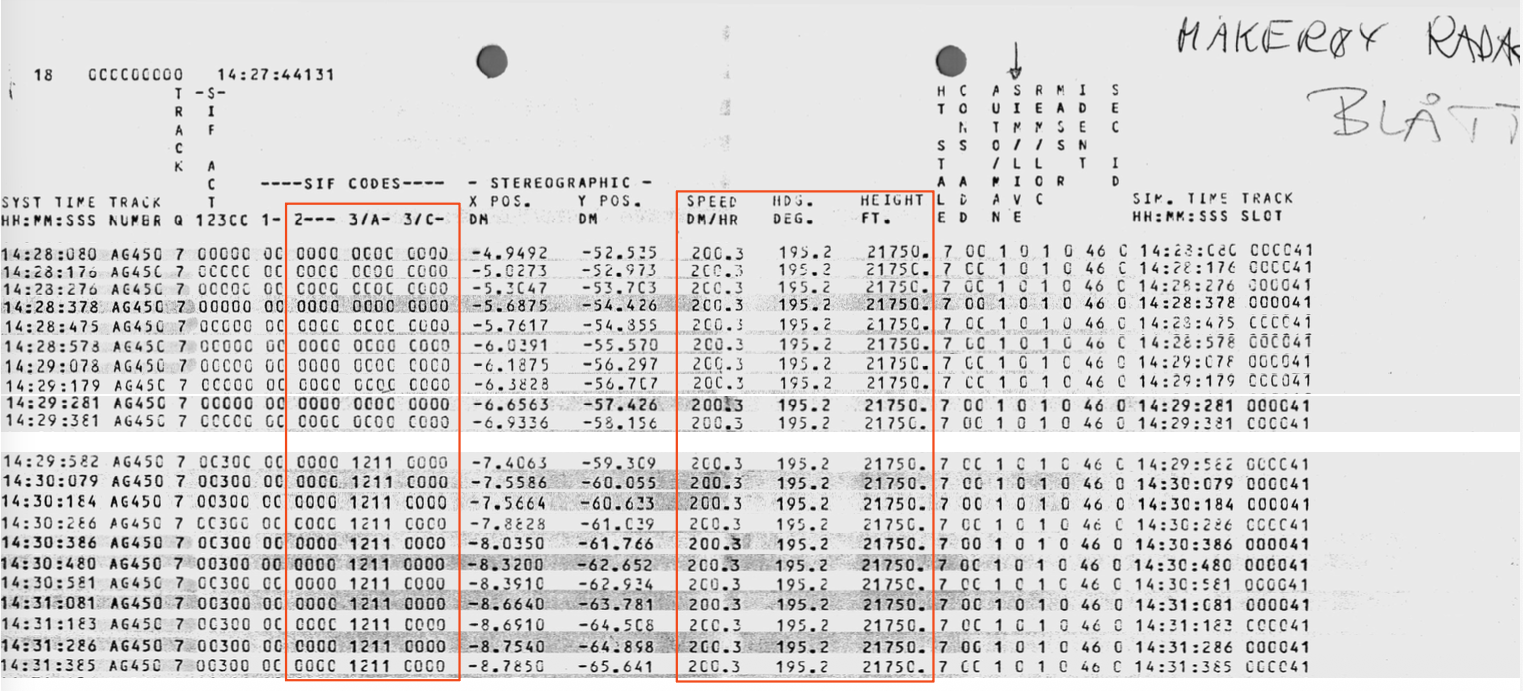
For Partnair, it is in practice only time and position that change in the Mågerø data, while speed, heading, and altitude are completely static. The transponder values for altitude (3/C) are missing, despite the aircraft's transponder functioning. In connection with the pass by the F-16, one line of data is missing, and after this, the identification (3/A) from the aircraft's transponder is registered.
The tracker in the radar system calculates speed and heading based on changes in position between each registration. By performing the corresponding calculation, it is confirmed that the static values for speed and heading are not real.
Partnair, Mågerø – static values. |
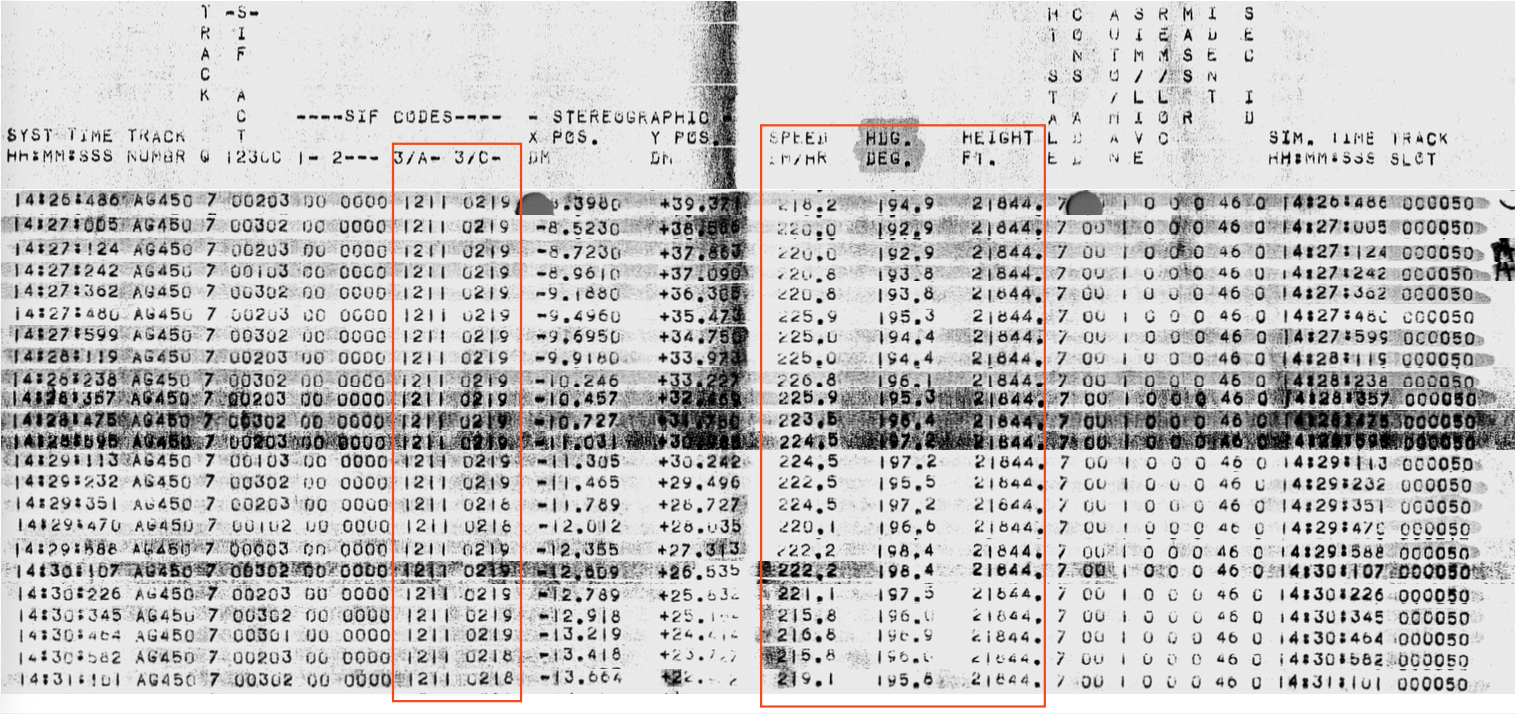
In the dataset from Skagen, there are apparently normal registrations from the Partnair aircraft's transponder. Speed and heading show even but varying values. The altitude measurement is static, which the radar system also indicates with the "HT STALE" value set to 7.
Partnair, Skagen |
Start Time of the Mågerø Printout
The Mågerø dataset has clearly been produced to show the time of passing. The printout starts at exactly 14:28:00.0, and for both the F-16 and the Braathens aircraft, there are 0 values where the transponder data should have been in the first lines. In addition, speed and heading are completely static, while position changes.
The Mågerø printout starts at 14:28:00.0. |

F-16, Mågerø: Static data in the first 2 lines. |

Braathens, Mågerø: Static data in the first 4 lines. |

The most plausible scenario is that data was played back from tape into the radar system. Where the tracker has not received updated data, 0 values or a previous value remain until new radar data arrives from the tape. The only thing that changes in the first lines is the position, which suggests it does not come from tape. It is difficult to establish whether these positions were produced by the simulation function in the radar system, whether they were entered manually, or whether they come from another unknown source.
The main point is: the printout from Mågerø is not a normal export of radar data, as one would expect in connection with the investigation of an aircraft accident, but a printout based on radar data produced less than five days after the accident to show the pass between the F-16 and the Partnair aircraft. The data printout shows that immediately after the accident, the focus was on the pass, and that radar data has been produced that bears the hallmarks of manual adjustment.
Braathens
The main focus is naturally on radar data for the F-16 and the Partnair aircraft, but the dataset also includes information about the Braathens aircraft (track number AG571). As mentioned above, the Braathens data starts with some static lines, but there are also other anomalies that are difficult to find a natural explanation for.
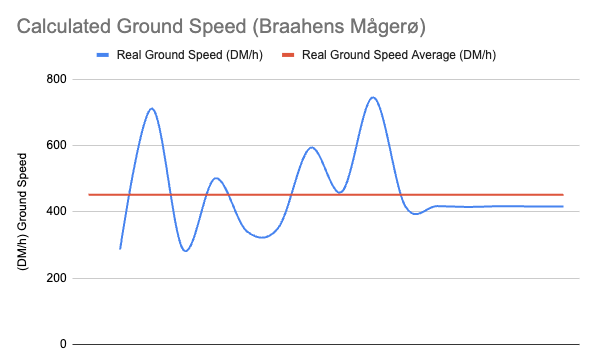
The radar's varying rotation speed cannot be explained by switching between Mågerø and Skagen, since the intervals should have been either approximately 10 or approximately 12 seconds. The Remote/Local column indicates a change of source, but the changes in rotation speed occur with both "remote" and "local" data. The actual speed of the Braathens aircraft was near the speed of sound, but of course not above or far below it.
System time | Interval | Track Number | 3/C Flight Level | Speed | Speed Calculated | Heading Calculated | Rem/Loc |
14:28:13.7 | AG571 | 0 | 277.6 | 1 | |||
14:28:21.4 | 7.7 | AG571 | 0 | 277.6 | 286.2 | 179.95 | 1 |
14:28:30.3 | 8.9 | AG571 | 0 | 277.6 | 712.1 | 213.93 | 1 |
14:28:41.0 | 10.7 | AG571 | 0 | 277.6 | 284.9 | 205.76 | 1 |
14:28:54.5 | 13.5 | AG571 | 290 | 359.6 | 501.3 | 187.31 | 0 |
14:29:06.6 | 12.1 | AG571 | 290 | 356.1 | 341.5 | 184.90 | 0 |
14:29:18.5 | 11.9 | AG571 | 290 | 356.1 | 352.6 | 184.26 | 0 |
14:29:30.6 | 12.1 | AG571 | 290 | 402.3 | 593.1 | 185.66 | 0 |
14:29:39.1 | 8.5 | AG571 | 290 | 423.2 | 460.5 | 185.37 | 0 |
14:29:42.4 | 3.3 | AG571 | 290 | 423.2 | 745.4 | 184.41 | 0 |
14:29:54.4 | 12.0 | AG571 | 290 | 423.2 | 417.2 | 184.65 | 0 |
14:30:06.4 | 12.0 | AG571 | 290 | 423.2 | 417.4 | 184.49 | 0 |
14:30:18.4 | 12.0 | AG571 | 290 | 423.2 | 414.7 | 184.35 | 0 |
14:30:30.4 | 12.0 | AG571 | 290 | 432.2 | 417.2 | 184.64 | 0 |
14:30:42.4 | 12.0 | AG571 | 290 | 423.2 | 416.3 | 184.49 | 0 |
14:30:54.3 | 11.9 | AG571 | 290 | 423.2 | 415.8 | 184.37 | 0 |
Errors in the time interval produce large deviations in the calculated speed. |
Speed Differences for the F-16
The most striking feature of the Mågerø radar data for the F-16 is that it shows supersonic speeds both before and in connection with the pass of the Partnair aircraft.
F-16, Mågerø |
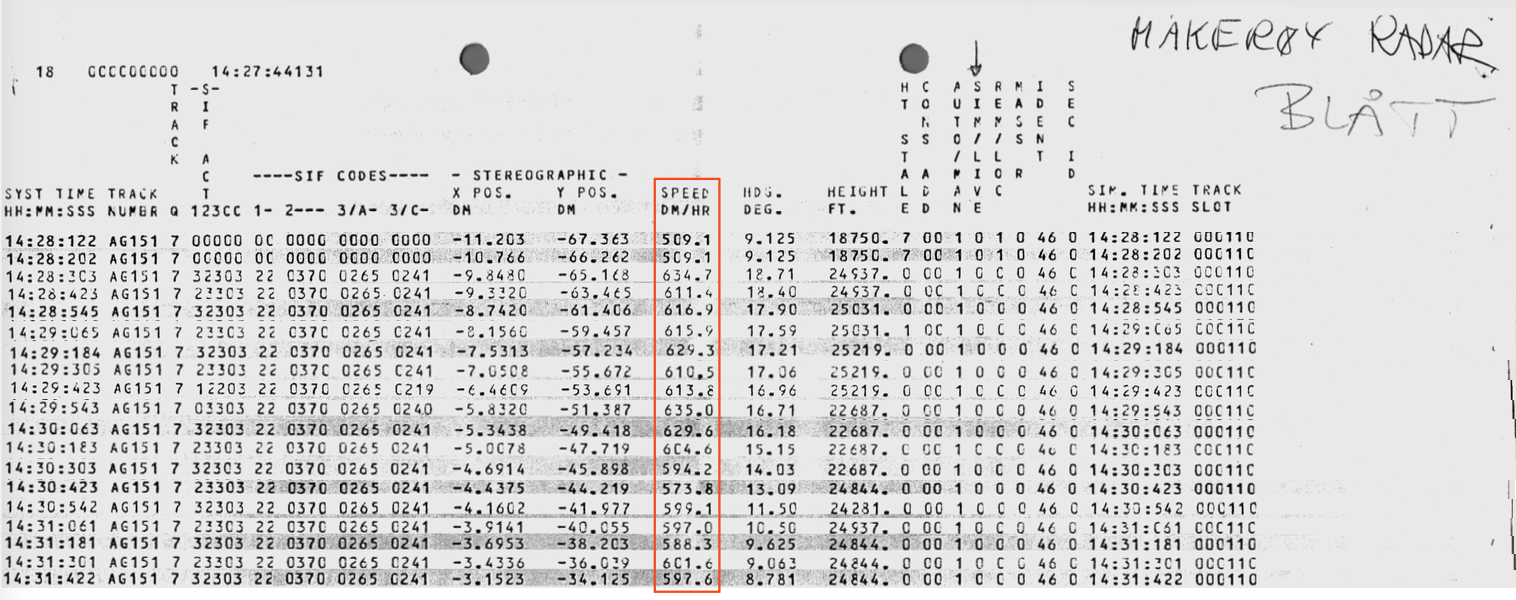
According to information from the Armed Forces, and the 12-second interval between each registration, the registrations should have been made by Skagen radar. The registrations in the printout from Skagen should therefore be identical—which they are not.
Given that the F-16 aircraft's speed is of particular interest in this case, it is worth noting that the Mågerø printout shows supersonic speeds, while Skagen shows speeds that are significantly lower. Two radar stations measuring the same aircraft may obtain different individual values for calculated speed, but over several minutes the average speed must be identical.
F-16, Skagen |
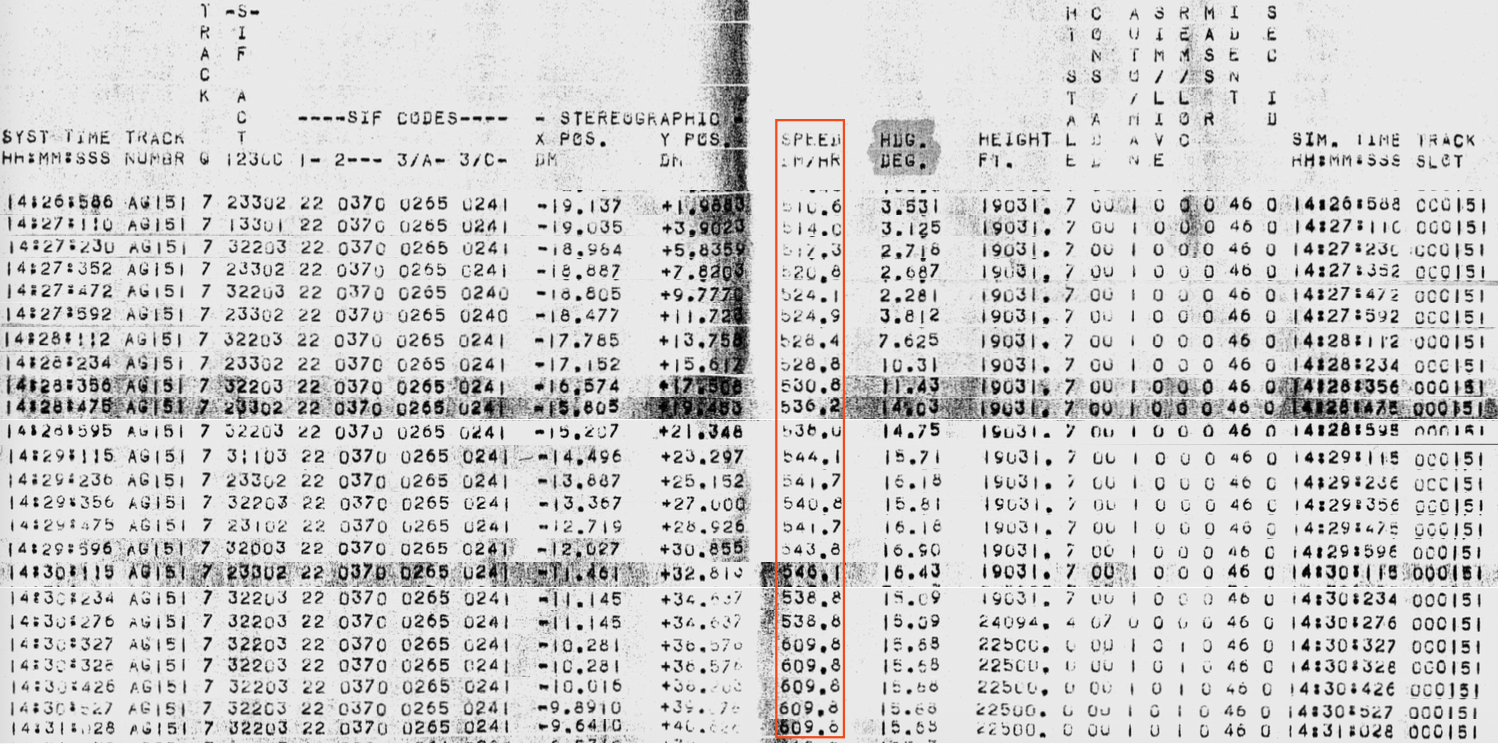
Rather than having speed values that change with every measurement, techniques for "smoothing" are employed in the radar system's tracker—in practice, average values from a given number of measurements. Smoothing cannot explain large speed differences over several minutes, as the datasets show between Skagen and Mågerø. Post-calculated values based on change in position over time also provide a clear indication that the speed values in the Skagen data are lower than what the F-16 aircraft actually had.
Skagen Tidspunkt | Skagen Speed | Skagen Calculated | F-16 | Mågerø Tidspunkt | Mågerø Speed | Mågerø Calculated |
14:28:47.5 | 536.2 | 631.5 | 14:28:30.3 | 634.7 | 507.8 | |
14:28:59.5 | 538.0 | 595.0 | 14:28:42.3 | 611.4 | 532.9 | |
14:29:11.5 | 544.1 | 621.2 | 14:28:54.5 | 616.9 | 630.9 | |
14:29:23.6 | 541.7 | 579.8 | 14:29:06.5 | 615.9 | 609.4 | |
14:29:35.6 | 540.8 | 574.9 | 14:29:18.4 | 629.3 | 697.3 | |
14:29:47.5 | 541.7 | 613.6 | Passing | 14:29:30.5 | 610.5 | 485.3 |
14:29:59.6 | 543.8 | 608.6 | 14:29:42.3 | 613.8 | 629.4 | |
14:30:11.5 | 546.1 | 617.2 | 14:29:54.3 | 635.0 | 715.2 | |
14:30:23.4 | 538.8 | 557.2 | 14:30:06.3 | 629.6 | 607.5 | |
14:30:27.6 | 538.8 | 0 | 14:30:18.3 | 604.6 | 518.7 | |
14:30:32.7 | 609.8 | 1495.4 | 14:30:30.3 | 594.2 | 553.5 | |
14:30:32.8 | 609.8 | 0 | 14:30:42.3 | 573.8 | 508.5 | |
14:30:42.6 | 609.8 | 824.6 | 14:30:54.2 | 599.1 | 682.2 | |
14:30:52.7 | 609.8 | 311.6 | 14:31:06.1 | 597.0 | 585.2 | |
14:31:02.8 | 609.8 | 419.4 | 14:31:18.1 | 588.3 | 558.5 |
Time Differences for the F-16
The timestamps in radar data have been a recurring theme in the lawsuits following the Partnair accident. The Armed Forces have established that the Mågerø timestamps are correct, while Skagen and AWACS have incorrect time indications:
«Skagen radar: the clock is 15 sec fast. Måkerøy radar: the clock is approximately correct. AWACS radar: the clock is 15 sec slow.» (Barvik, 1990, p. 2)
In practice, this means that all radar data showing one aircraft at the same position in the Skagen and Mågerø datasets should have approximately 15 seconds' difference in the timestamp. Since the printouts from Mågerø and Skagen have separate data sources, none of the points are identical. To calculate the time difference, one must:
- Find a point that is close in both datasets
- Calculate the distance between the two points
- Adjust the timestamp to compensate for the time it takes the aircraft to fly the distance
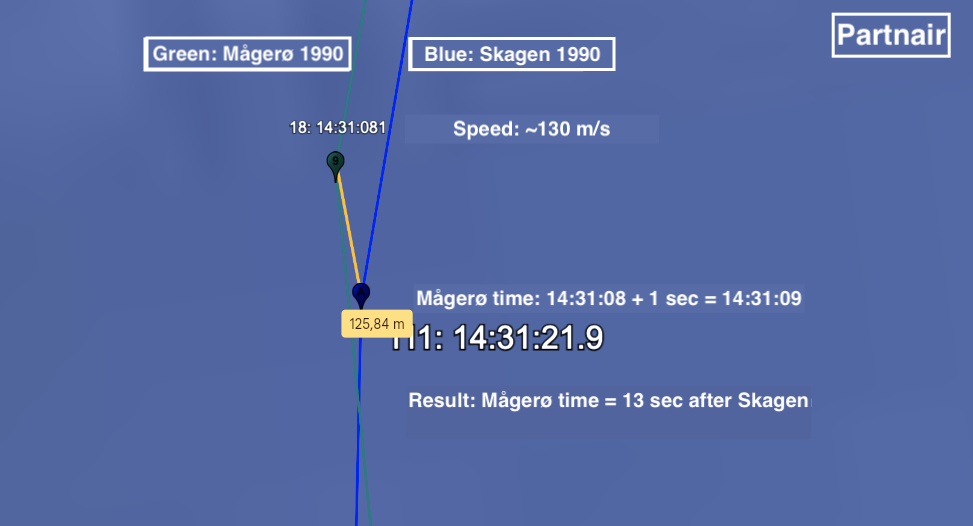
For all aircraft in the two datasets, this exercise should always yield the same time difference. This is not the case. If one compares the timestamps for the Partnair aircraft, it is consistent with approximately 15 seconds' time difference. For the F-16, the time difference is approximately double.
The Partnair aircraft's position yields a time difference of approximately 13 seconds between Mågerø and Skagen. |
The F-16 aircraft's position yields a time difference of approximately 28 seconds between Mågerø and Skagen. |
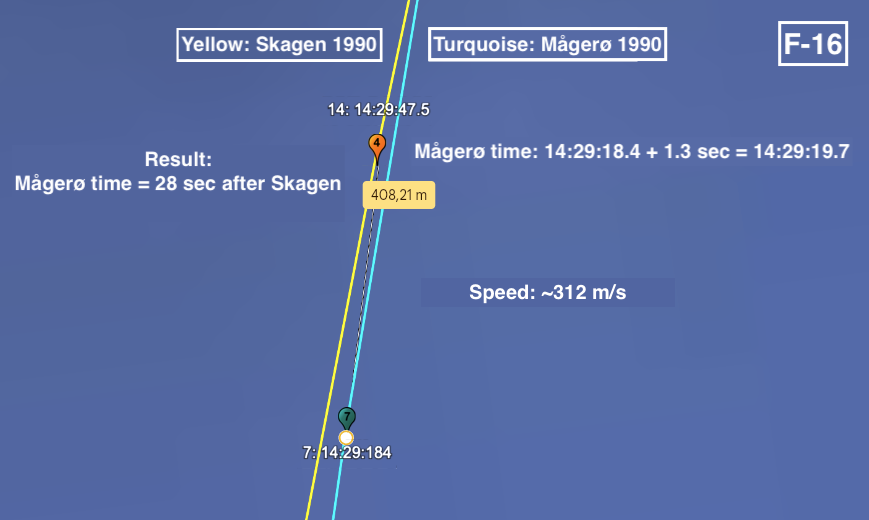
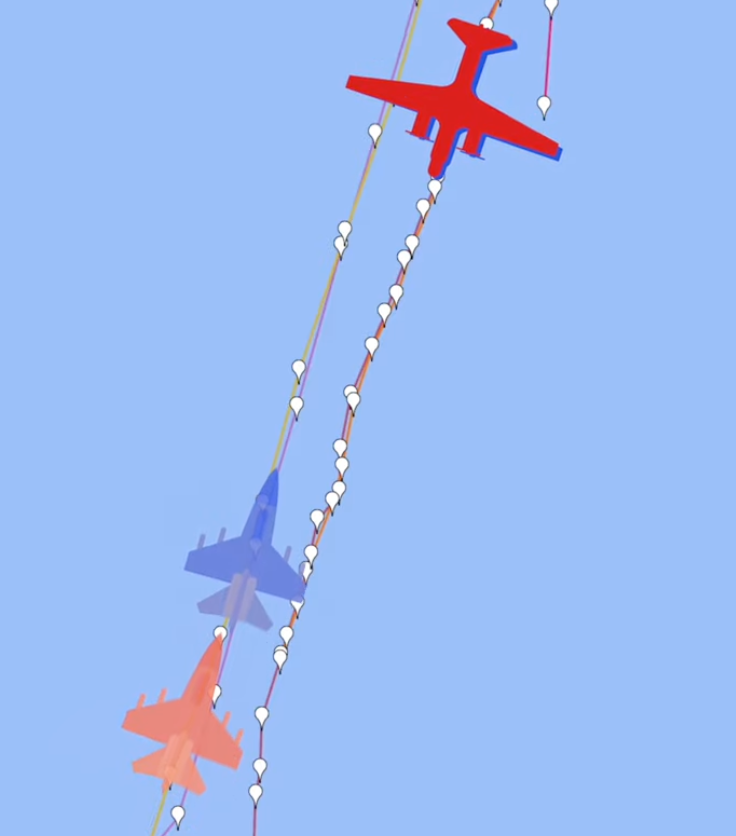
This reveals a physically impossible situation where Skagen and Mågerø register the F-16 at a given time as being in two different locations several kilometres apart. It is difficult to visualise this impossibility by studying numerical data, but when the radar data is animated, it becomes obvious.
In the animation, the timestamps are synchronised so that they correspond between Skagen and Mågerø for the Partnair aircraft. If the radar data were real, the red and blue F-16 aircraft would be as closely aligned as the Partnair aircraft. It is not possible to explain this large time discrepancy by low precision in the radar systems. The difference between Skagen and Mågerø constitutes a period longer than the rotation period of the radar heads at both stations.
Radar data showing physically impossible observations of the F-16. https://www.youtube.com/watch?v=7brfTxEplAQ |
Impossible Situations in the Skagen Data
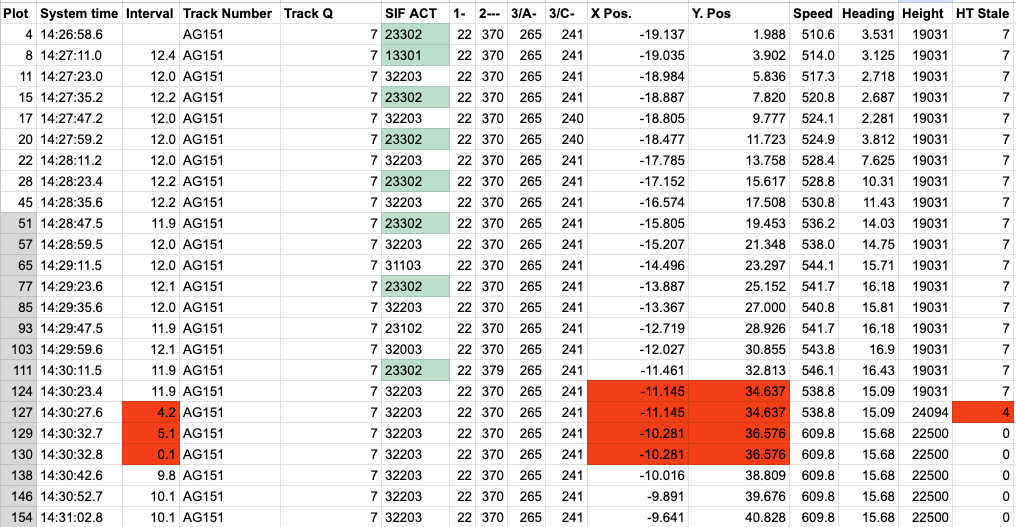
According to the radar data from Skagen, abnormal situations arise in connection with the pass of the Partnair aircraft: the radar changes rotation speed, and the F-16 is registered at exactly the same position despite several seconds elapsing between measurements.
Another impossibility is the "HT Stale" column to the right of the altitude measurement. This value can increase or return to 0, but it cannot go from a high value to a lower value without having gone via 0 first. In the Skagen dataset for the F-16, there is an instance of the value changing from 7 to 4—something that would not occur in a real dataset.
F-16, Skagen |

F-16, Skagen |
The Skagen Versions
Version 1990
In the post-processed radar data, which the Armed Forces delivered to the accident investigation board several months after the aircraft accident, data for the different aircraft has been split into separate documents. The most obvious errors—the change in the radar's rotation interval and identical registrations at two different timestamps—are still present in this printout.
Despite the fact that both Skagen and Mågerø were part of the NATINADS network and both received data from each other in real time, a line has been inserted stating "track reporting transferred to Måkerøy radar." The printout from Skagen was produced by the tracker at Skagen, and both the F-16 and Partnair were well within range. The line marks a division where radar data from different sources has been stitched together. Regardless of whether one chooses to accept this explanation, and why it only applied to the F-16 aircraft, it does not explain the physical impossibilities shortly beforehand.
F16, Skagen, 1990 |
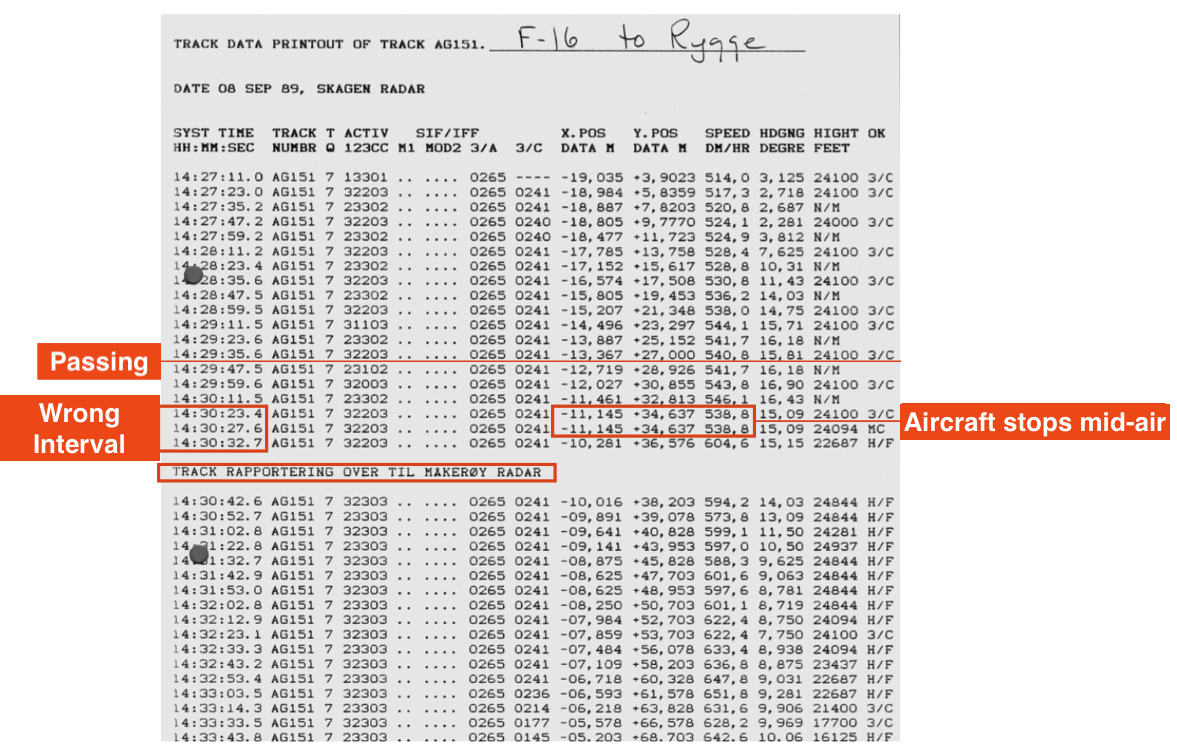
If one compares the printout from 1989 with the 1990 version, one can see that one line has been removed. In addition, the column with altitude data has been changed. The static speed and altitude measurements at the end of the dataset, showing supersonic speed and an altitude for the F-16 of 22,500 feet, have been altered. The HT-Stale column, which shows 0 values at the end of the dataset indicating completely fresh altitude measurements, has not been carried over to the 1990 version.
Overall, it appears that attempts have been made to correct some of the data, as well as to make the altitude data somewhat more consistent.
F-16, Skagen, 1989 vs 1990 |
Version 1992
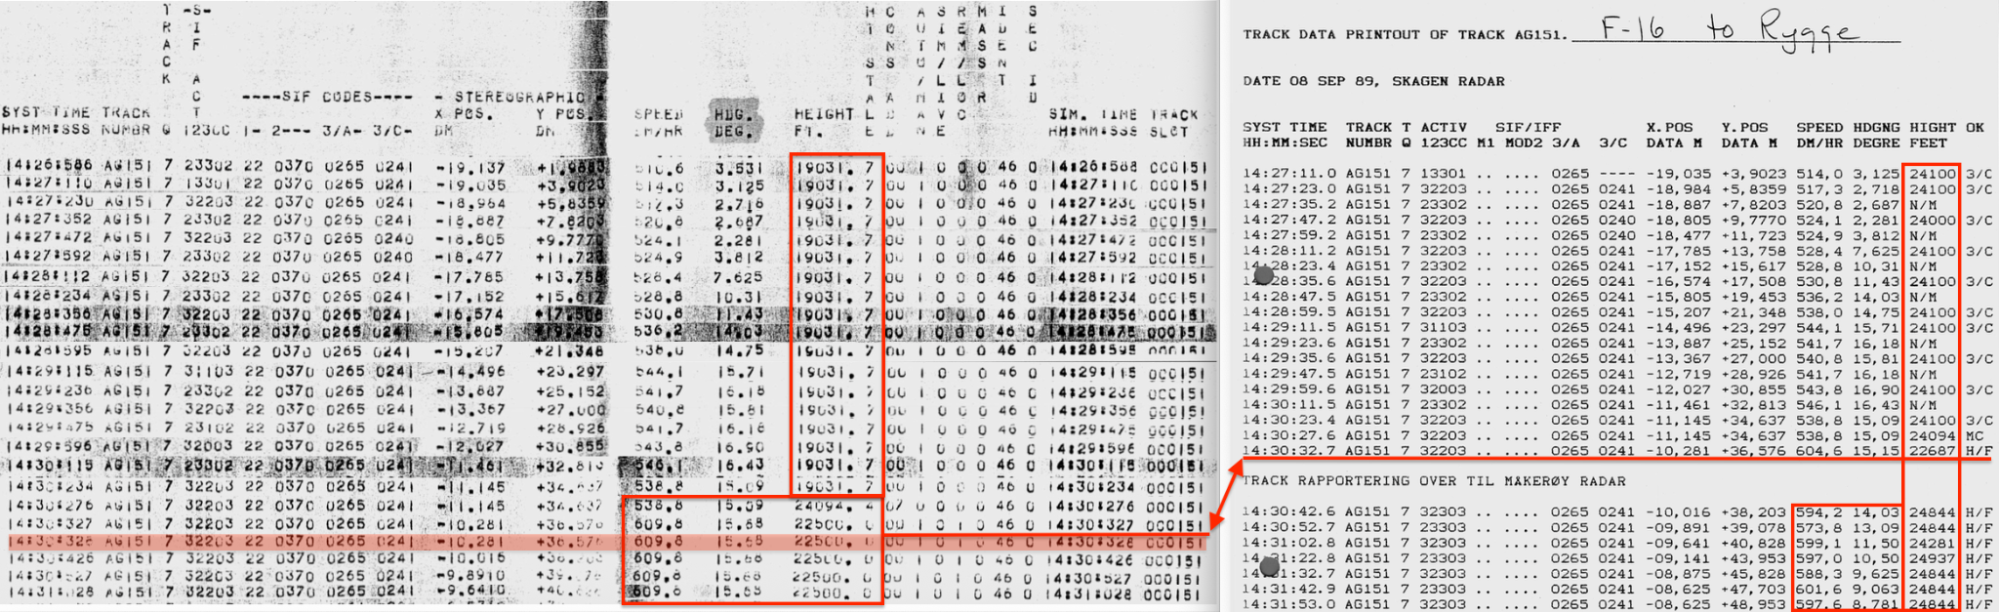
In August 1992, the Armed Forces delivered yet another version of the radar data. The most obvious change was that all timestamps had been adjusted by −15 seconds. The changes were made by hand, as several errors have crept in that have been corrected with pen. Given that the new version was delivered under the pretext that the timestamps needed to be changed, this should also have been the only change. However, several other corrections have been made.
F-16, Skagen 1990 vs 1992 |
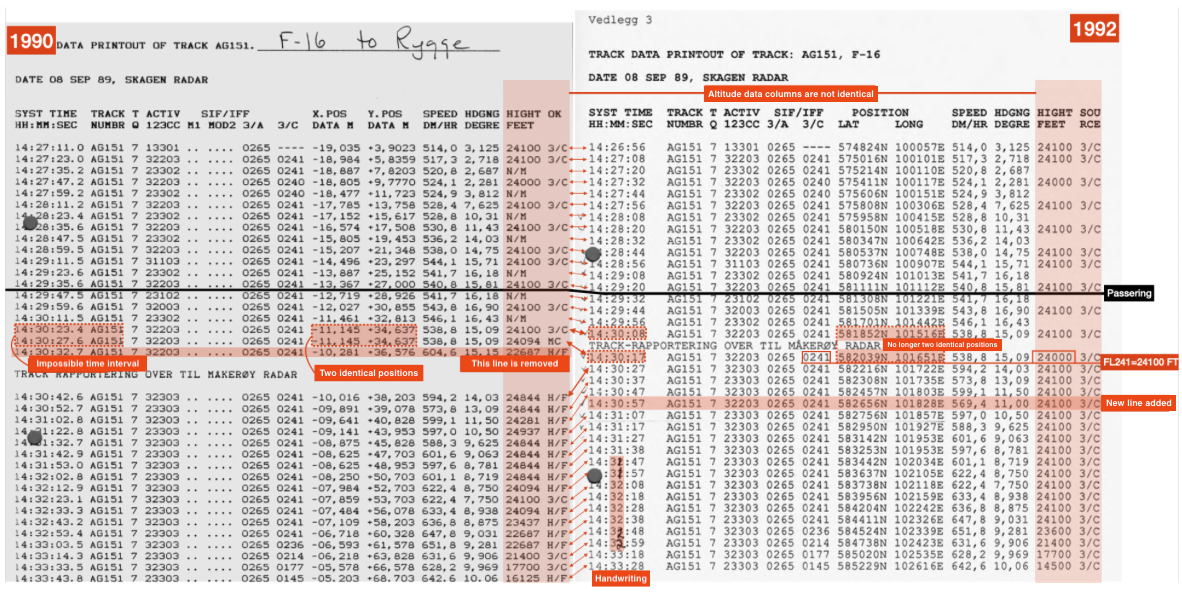
This is clear evidence that someone has manually made corrections where the dataset shows physical impossibilities. The registrations showing that the F-16 was stationary in the air for 4.2 seconds have been removed. A new registration has been inserted a few rows further down so that the total number of lines remains the same.
Another important observation is that the altitude data has been manually adjusted. In the altitude column of the 1990 version, one can clearly see that two different datasets have been spliced together, where the latter part has few Mode C registrations. It is evident that someone has wished to remove any doubt about the F-16's altitude, and has therefore manually written in the number of feet in the altitude column of the 1992 dataset. That this was done manually is confirmed by the fact that one of the lines contains an arithmetic error: Flight level 241, registered in the 3/C column, becomes 24,100 feet when multiplied by 100—not 24,000 feet as stated.
AWACS
Printouts
The printouts from the AWACS registrations have built-in noise and discrepancies between what was registered by primary and secondary radar respectively. The main problem is that most of the registrations of the F-16 are classified. Only 9 points have been released as "NATO Unclassified."
F-16, AWACS |
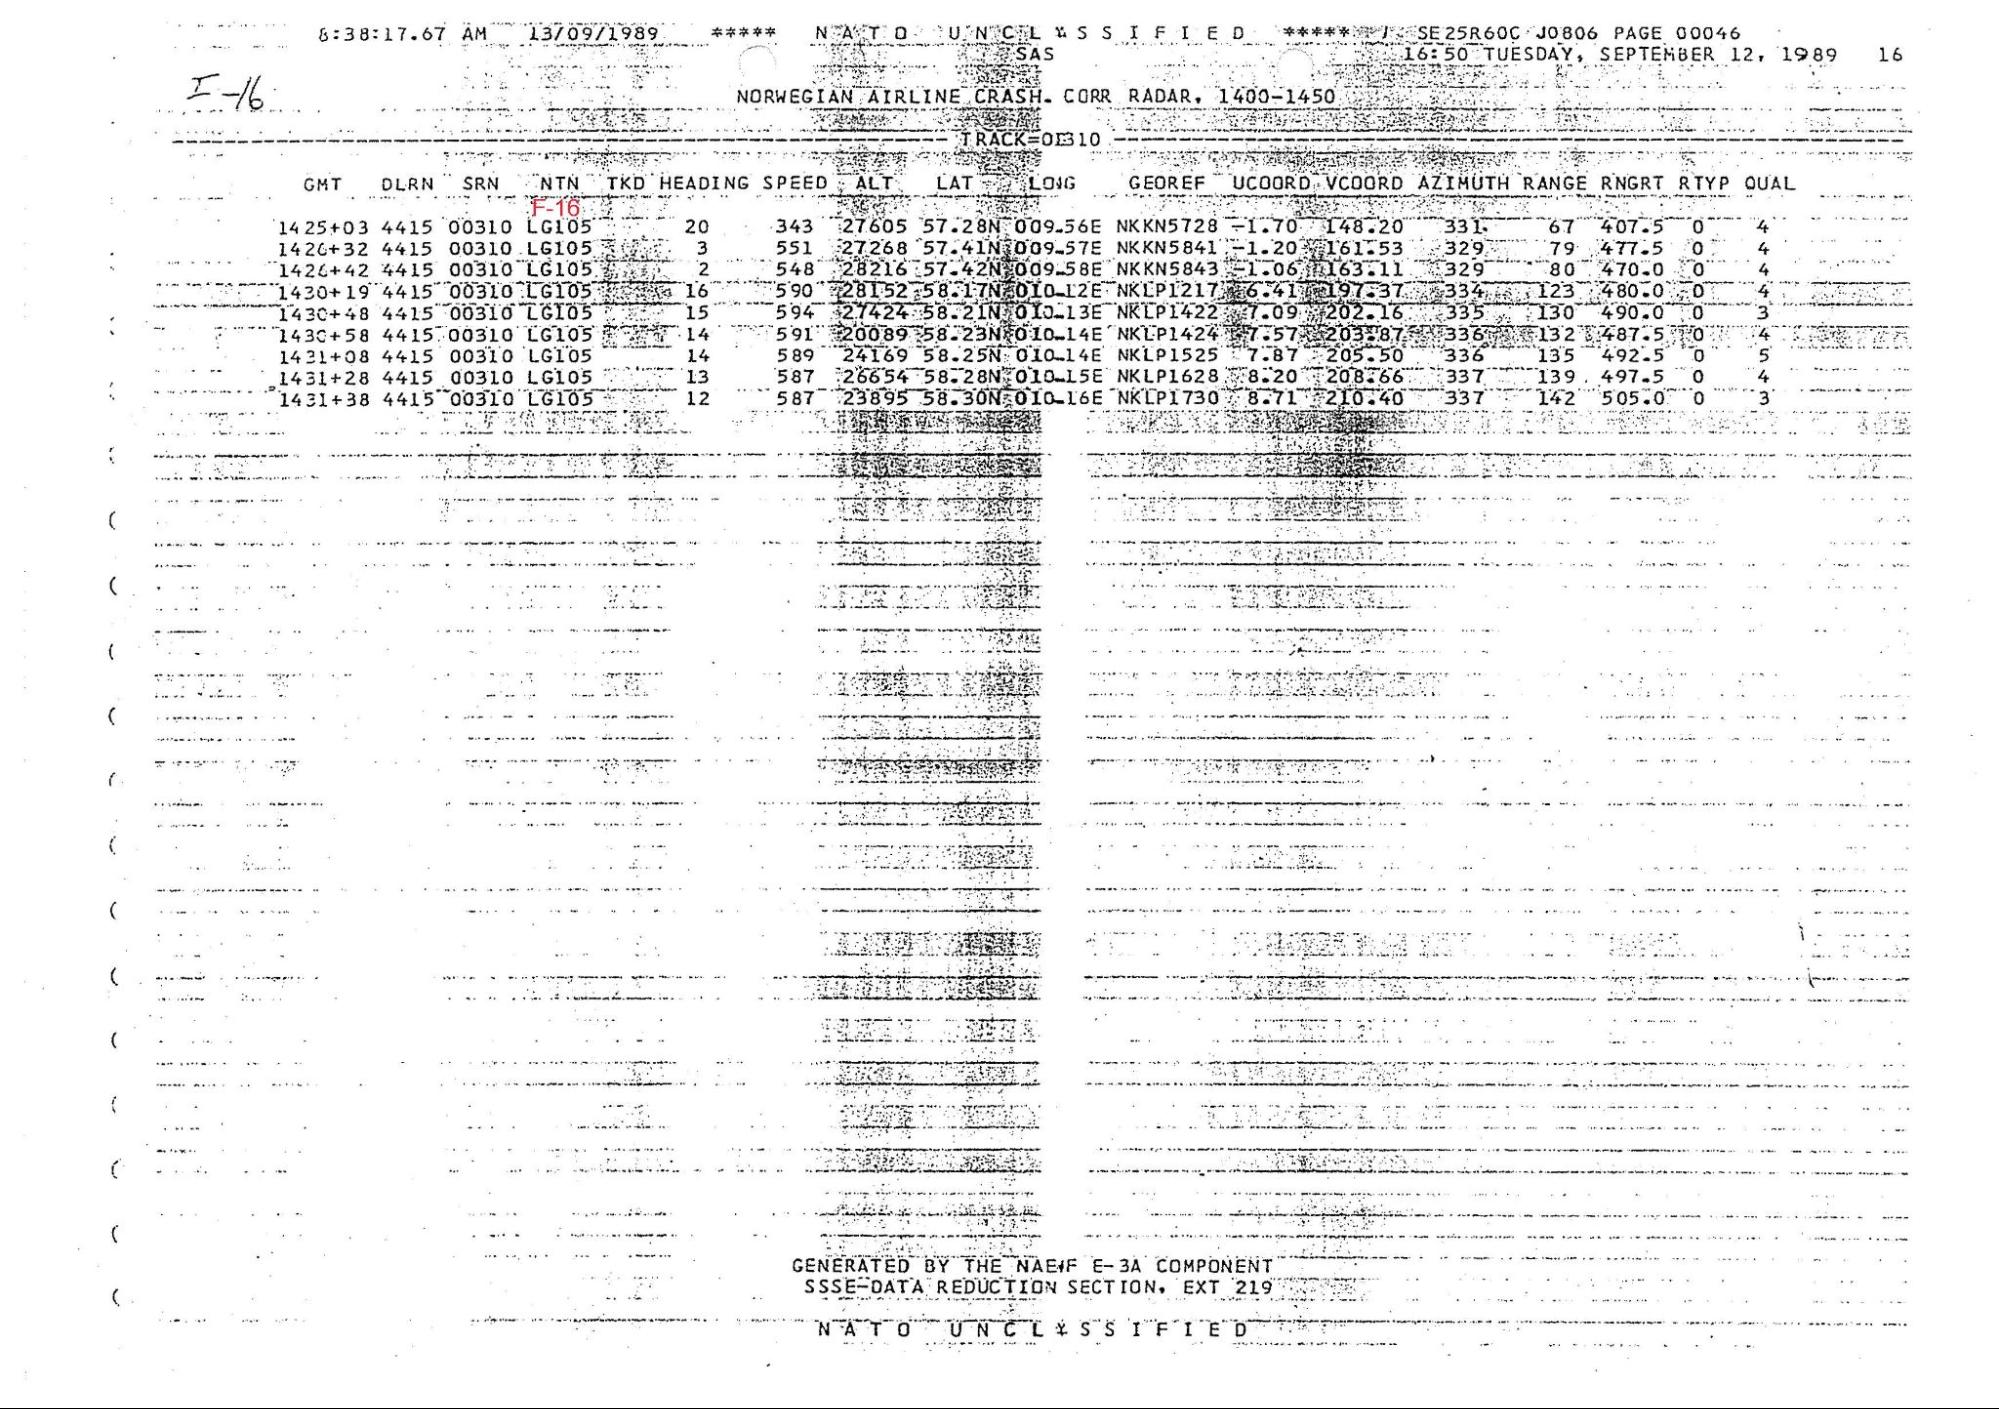
Noise
The AWACS radar printouts have obviously reduced resolution. Regardless of whether this was done to avoid revealing military secrets about the radars' precision or for another reason, it constitutes a very large amount of noise in the data. Noise has been systematically introduced with such large deviations that the data cannot be used to establish where the F-16 and Partnair were in relation to each other at the time of passing.
Two sets of data have been delivered for Partnair: primary radar and secondary radar (labelled IFF in the dataset). These tracks should in theory have been approximately identical, but there is at times several kilometres' distance between them.
Partnair, primary and secondary radar (IFF) track, with reduced resolution. |
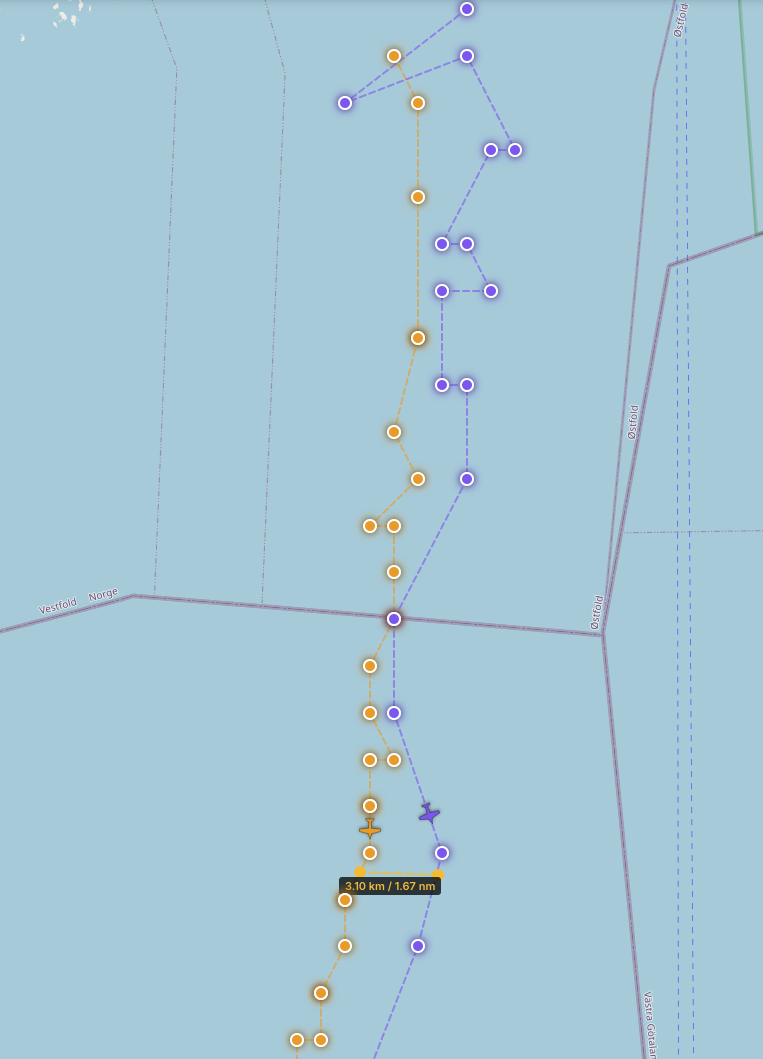
AWACS aircraft track with reduced resolution, jagged track instead of a smooth circle. |
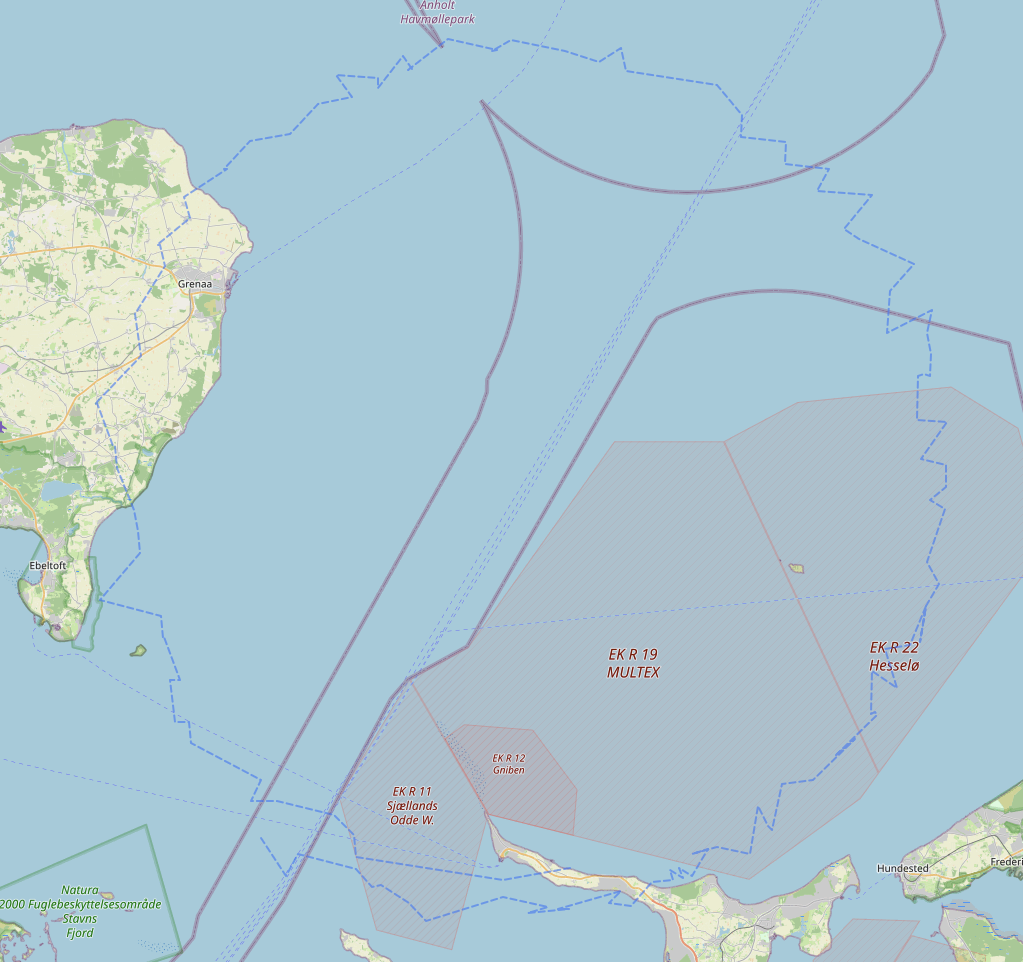
AWACS, F-16, Partnair (Primary + Secondary/IFF). |
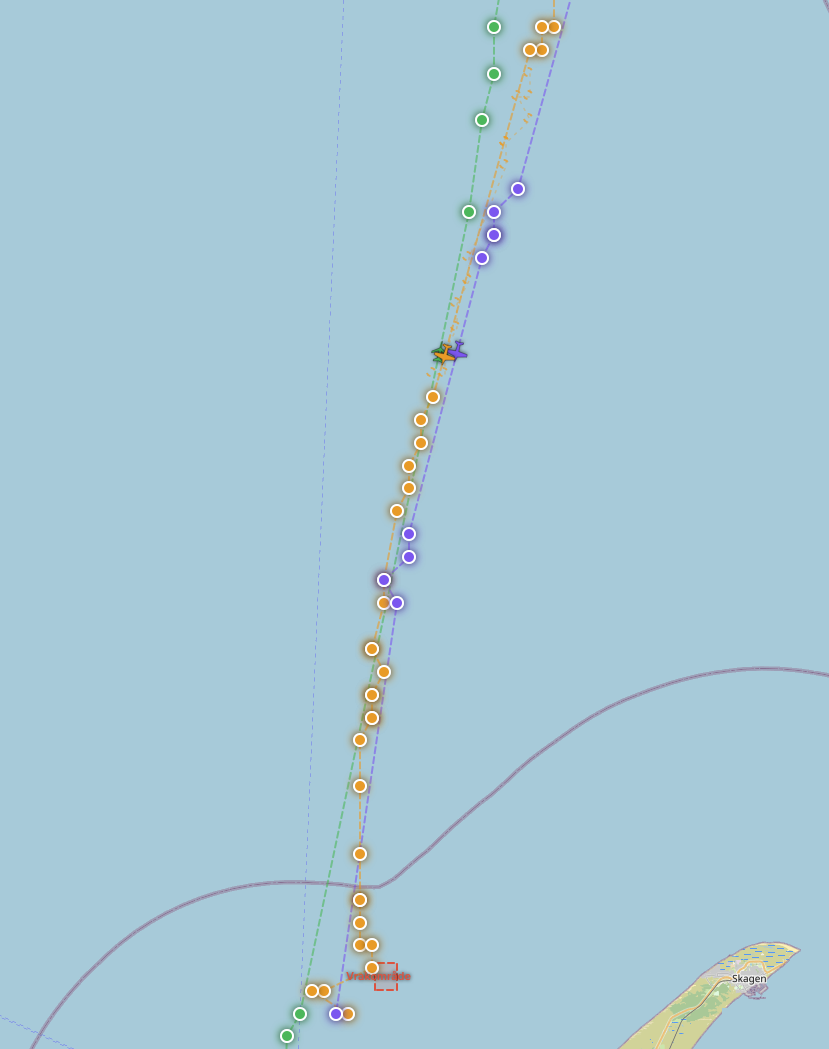
AWACS versus Skagen
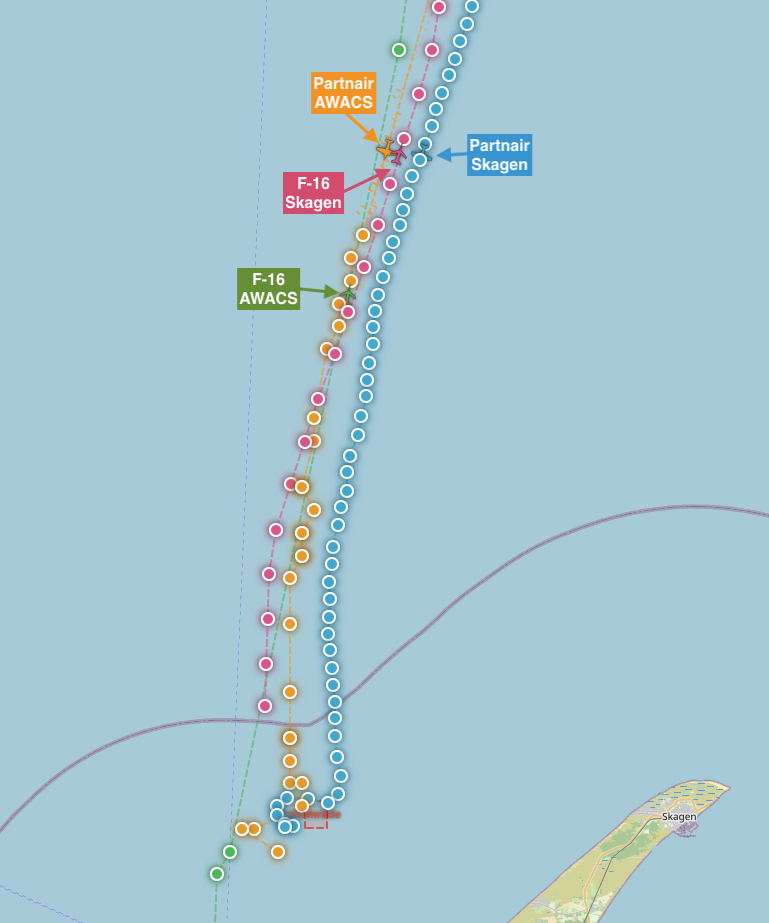
Both Skagen and AWACS were relatively close to the F-16 and Partnair aircraft and should have relatively high precision. A systematic deviation of several kilometres is difficult to understand.
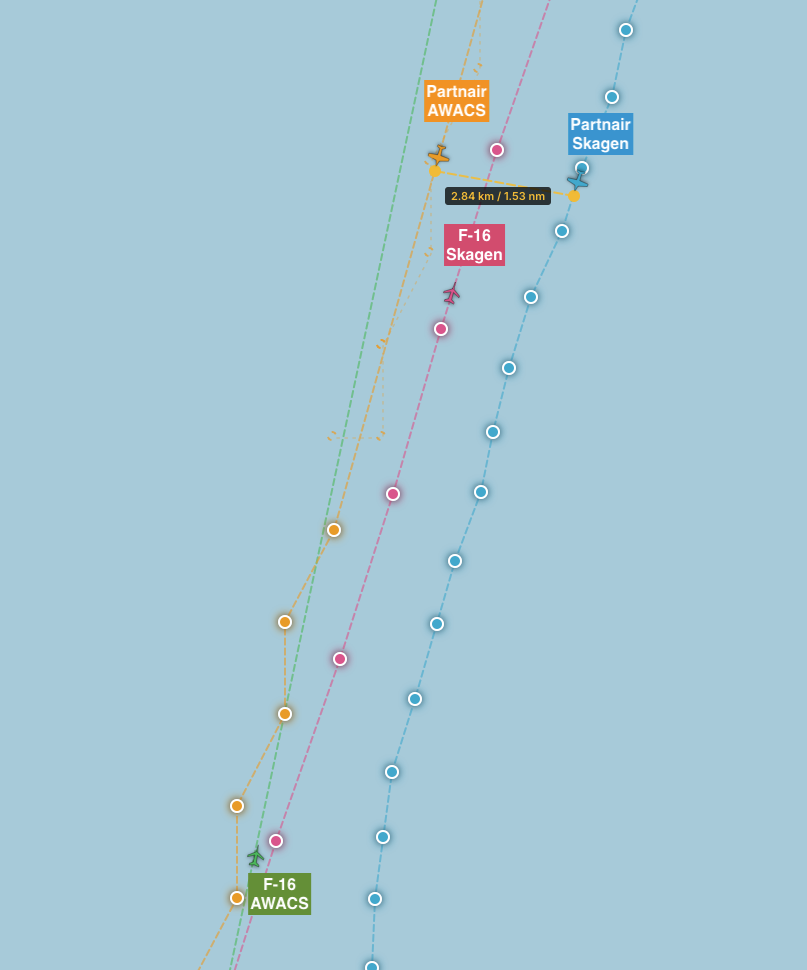
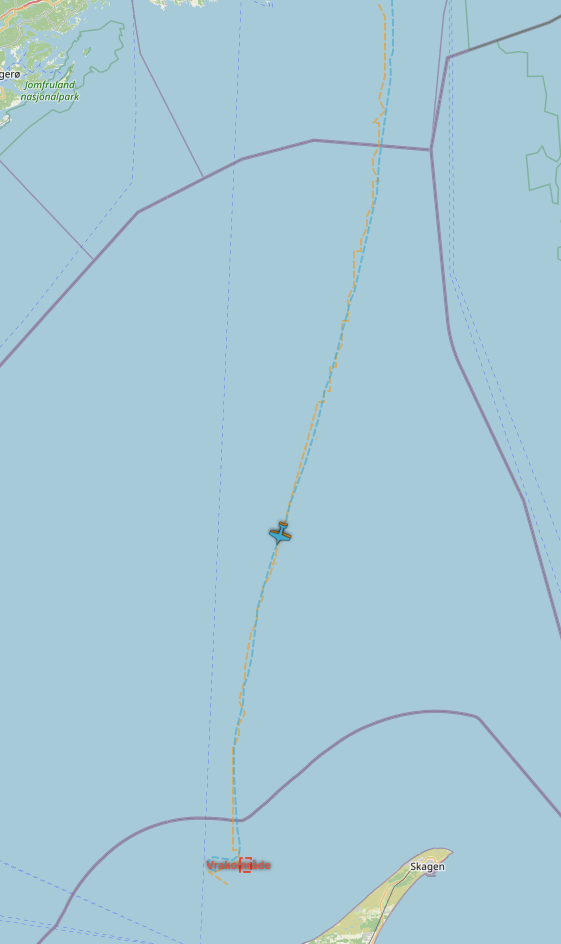
If one compares the Partnair aircraft track between Skagen and AWACS, it looks fairly coincident, but the tracks appear to have a systematic measurement error of 3 kilometres in the east/west direction.
AWACS, Skagen, F-16, Partnair, overview. |
AWACS, Skagen, F-16, Partnair, near the meeting point. |
Partnair AWACS track, with the entire Skagen track shifted 3 km westward. |
AWACS-video
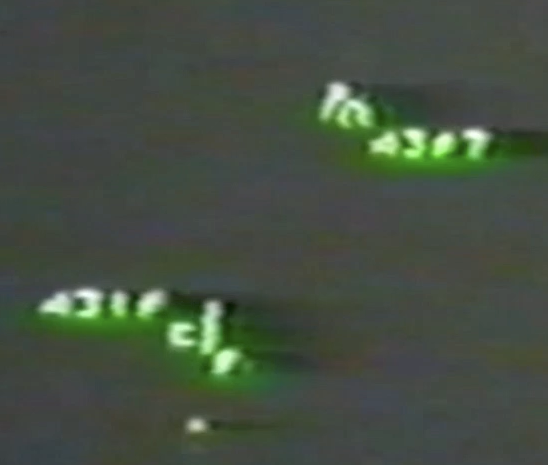
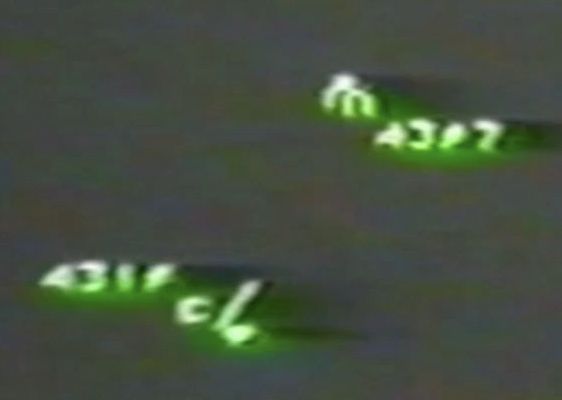
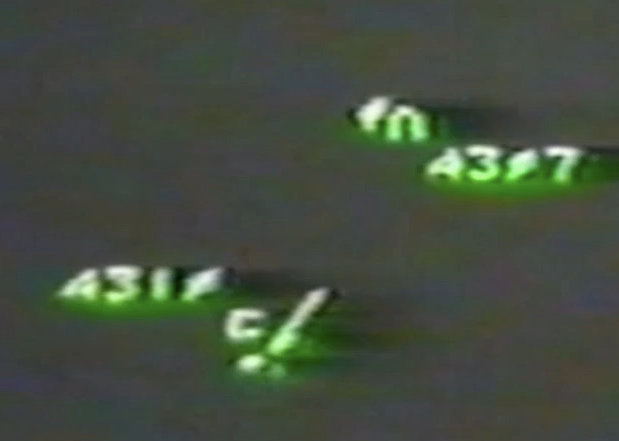
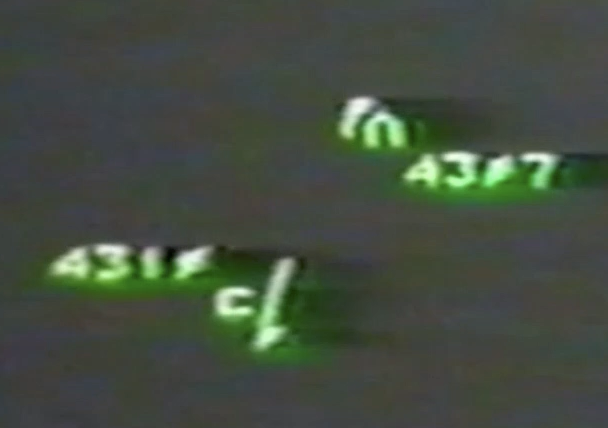
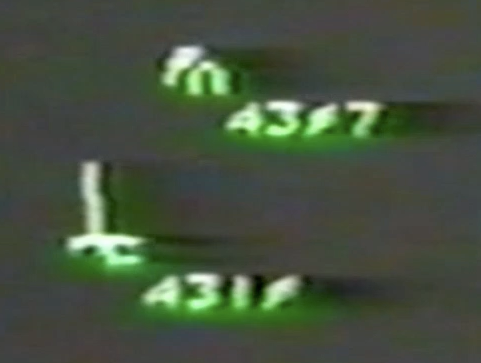
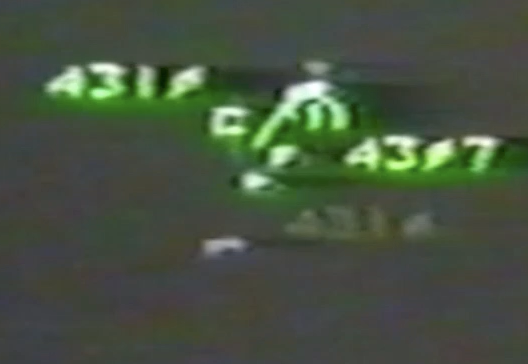
Data from AWACS has been video-recorded by hand and shows Partnair (track 4307), the Norwegian F-16 (track 4310), and the Braathens aircraft (track 4311). This is a post-hoc simulation, where recordings of radar data from the accident have apparently been used.
In addition, track 4304 is visible on the radar screen. Track 4304 is flying in the direction of Aalborg at relatively high speed and is located over Denmark when Norwegian 5007 takes off and flies northward. The radar images show that 4304 reduces speed and apparently makes an approach towards Aalborg.
The AWACS radar data shows a number of other aircraft in the area, which suggests that the Mågerø data should have included far more aircraft. Viper 20 and 71 are aircraft that naturally should have been included in the dataset, as they were two military aircraft operating in the same area shortly before the accident.
Viper 71 and 20
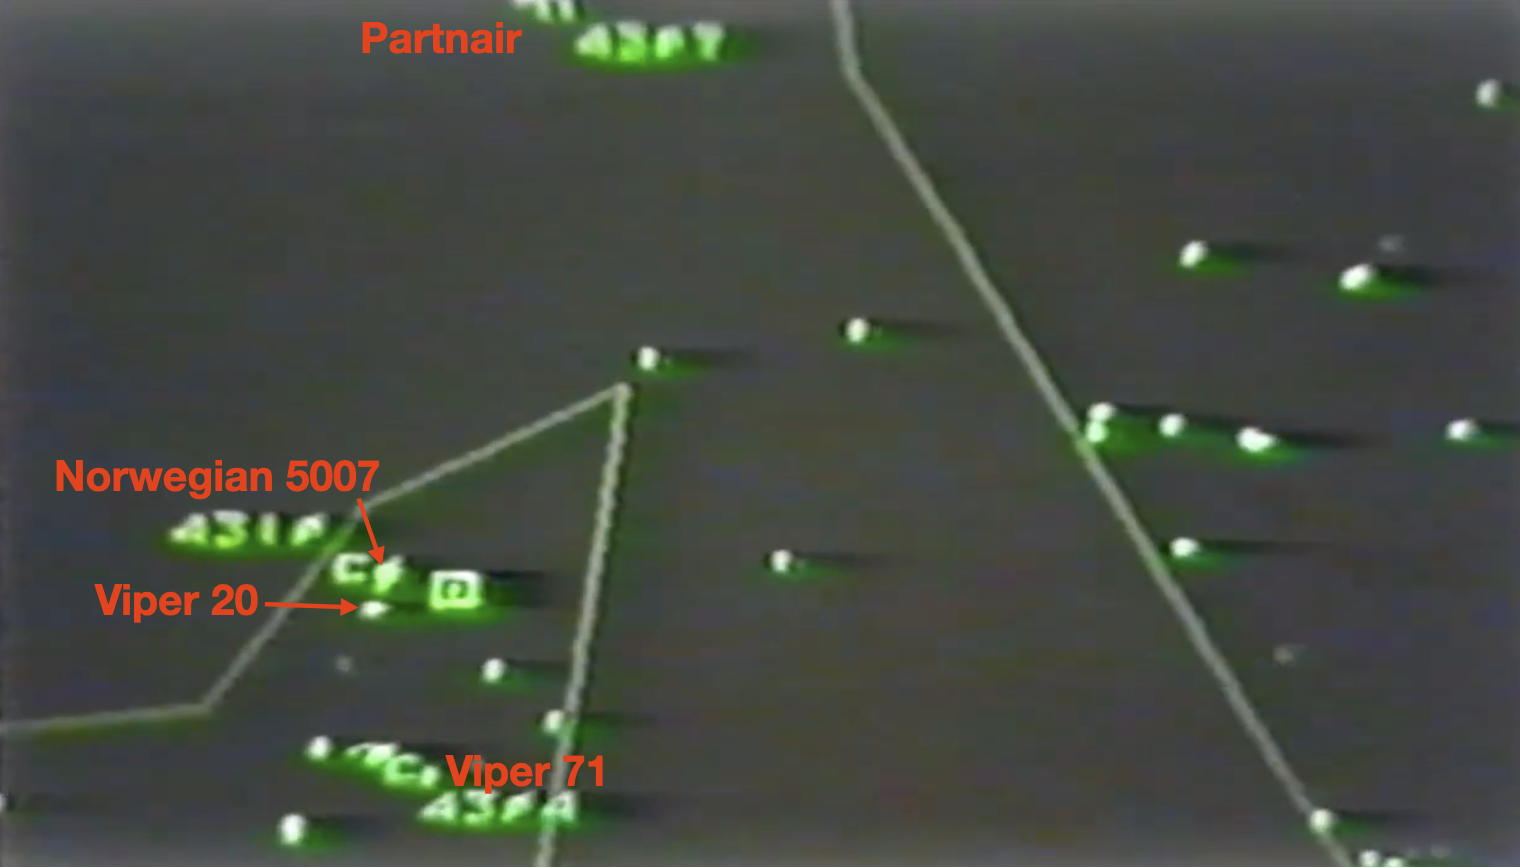
Ahead of Partnair, first Viper 71 flew, followed by Viper 20. Viper 71 is registered as track 4304 by AWACS.
Viper 71 and 20 on AWACS radar. |
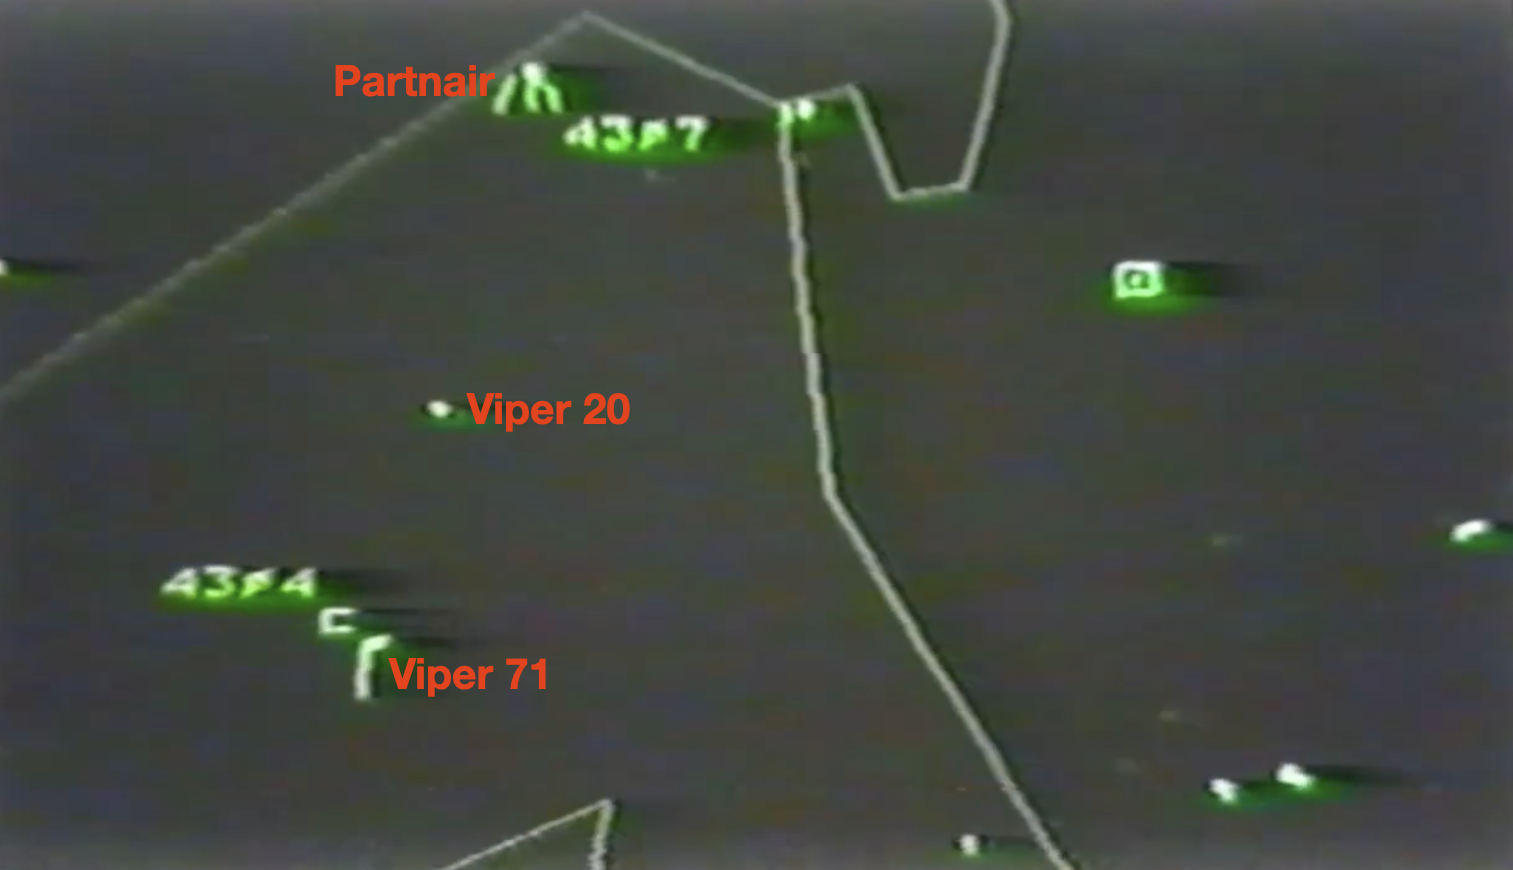
Directly over Hirtshals, the AWACS radar shows Viper 20 and Norwegian 5007 meeting. It may be that the F-16 crew assumed this was the first of the two fighter jets, while in reality it was the last. This assumption may have been reinforced by the F-16's own radar detecting the Partnair aircraft, which at that point was over the Skagerrak heading towards Rygge.
The encounter between Viper 20 and Norwegian 5007. |
F-16 Heading Changes
Prior to the encounter with Partnair, the F-16 makes several heading corrections and appears to pass the Partnair aircraft very closely.
|
|
|
|
|
|
The Pass in the AWACS Video
Just before the pass, the operator clicks with the cursor on the radar plot for the Partnair aircraft and the F-16 aircraft, probably to obtain information from the radar system:
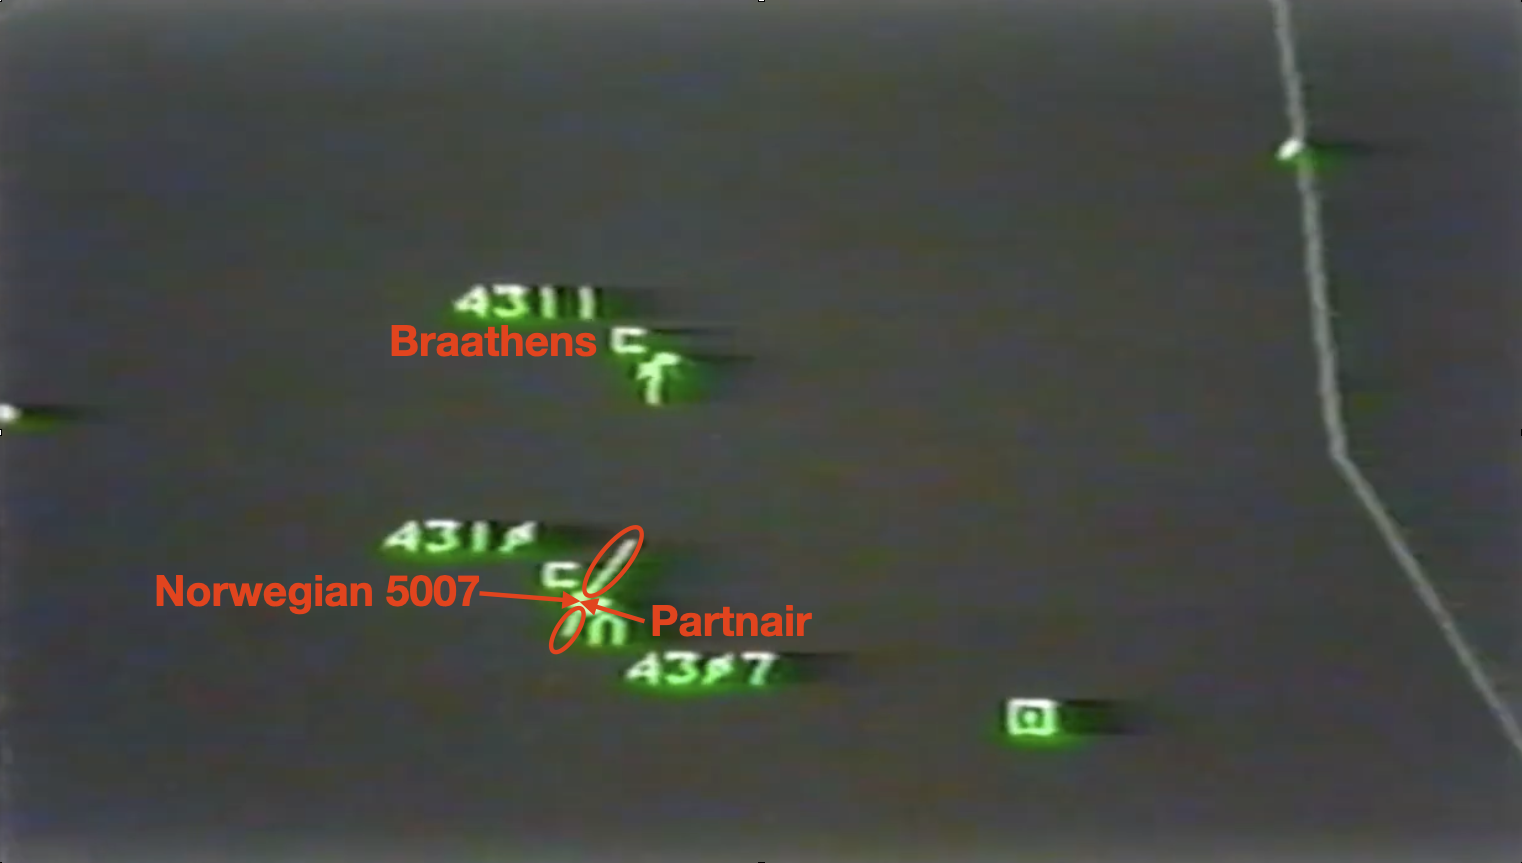
«The subject track has track 4310 off its nose, bearing 211 for two miles. The altitude separation appears to be 2,000 feet, there is a difference of altitude of 21,800 feet and 24,100 feet. The subject aircraft is flying underneath the northbound track.» (19:21 in the video)
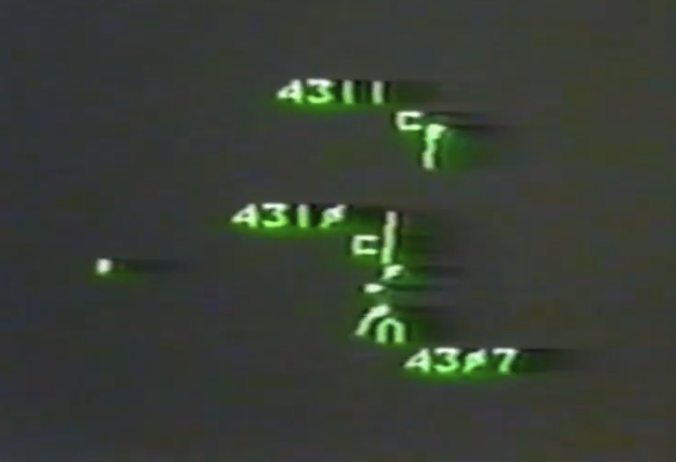
The pass occurs before the operator has finished reading out the quote. "Two miles" is two nautical miles, and at a relative speed of 450–500 m/s, this distance is covered in 7–8 seconds. Based on radar data from Skagen, the F-16 should not have come closer than one nautical mile, but the AWACS video shows the aircraft continuing to approach each other until the radar plots merge. After the encounter, the F-16 turns to the left.
The radar plots merge at the time of passing; the F-16 maintains high speed. |
After the pass, the AWACS video shows the F-16 turning to the left. |
Swedish Radar
Just before the pass, the operator clicks with the cursor on the radar plot for the Partnair aircraft and the F-16 aircraft, probably to obtain information from the radar system:
«The subject track has track 4310 off its nose, bearing 211 for two miles. The altitude separation appears to be 2,000 feet, there is a difference of altitude of 21,800 feet and 24,100 feet. The subject aircraft is flying underneath the northbound track.» (19:21 in the video)
The pass occurs before the operator has finished reading out the quote. "Two miles" is two nautical miles, and at a relative speed of 450–500 m/s, this distance is covered in 7–8 seconds. Based on radar data from Skagen, the F-16 should not have come closer than one nautical mile, but the AWACS video shows the aircraft continuing to approach each other until the radar plots merge. After the encounter, the F-16 turns to the left.
The radar plots merge at the time of passing; the F-16 maintains high speed.
After the pass, the AWACS video shows the F-16 turning to the left.
Swedish Radar
The Swedish radar stations were of an older, analogue type. Recordings were made by photographing the radar screen every 40 seconds. In practice, the F-16 moved 12 kilometres between each image. This is not sufficient precision to see whether the F-16 made heading corrections. When the F-16 additionally passed so close to the Partnair aircraft that the image points merged and became invisible, at the time of passing there were only two points for the F-16 with 80 seconds between them—a straight line in the sketch corresponding to 24 kilometres.
The speed calculation shows that the F-16 was flying just below Mach 1 over this distance. Any turn away from the straight line increases the distance, and thus in practice indicates supersonic speed. It is also worth mentioning that despite a very straight track—due to few registrations—the pass is registered with a separation of 0.5 nautical miles, which is half the separation shown in radar data from Skagen and Mågerø.
On 7 January 1993, Jon P. Pran wrote to Chief Radar Analyst Gunno Gunnvall:
«The report regarding the Metropolitan accident on 8 September 1989 has been out for consultation. Certain consultation bodies have noted that the radar information from the Swedish Armed Forces does not contain the position where a Norwegian F-16 fighter jet passed the Metropolitan aircraft LN-PAA. According to Norwegian radar and the pilot in question, this occurred at 1429:30 UTC when the F-16 passed approximately 1 NM west of LN-PAA. If you still have this radar information, could you send us the time and position of the pass.» (Pran, 1993, p. 1)
Radar analyst Gunnvall replied and enclosed a new sketch:
«I have made a plot of the two frames 1429.05 and 1430.25 (UTC), thus the simultaneous mutual positions of LN-PAA and the F-16.
I also have a frame at 1429.45 (You will recall that the film was taken with one image every 40 seconds) but on that frame the two aircraft were so close to each other that both echoes merged (the light spreads in the picture tube glass and blackens the film). That frame was therefore not usable.
By calculating the aircraft ground speed for these 80 seconds, I obtained 300 metres/second for the F-16 and 131 metres/second for LN-PAA. The two distances were 24 and 10.5 kilometres respectively. From this, I have interpolated the position and time of the pass according to the sketch on the next page.
The result was that the F-16 passed approximately ½ (one half) nautical mile west of LN-PAA. The F-16's position was then 5812N 1012E and the time was 1429.48.
I have no concrete altitude information but have an impression that the F-16 was then (at the pass) flying lower than LN-PAA. Am not certain of this, however. (I have assessed that the F-16 departed from Aalborg at approximately 1421 and initially climbed over Jutland but decreased altitude before the encounter with LN-PAA. Is this correct?)» (Gunnvall, 1992, p. 1)
(Gunnvall, 1992) Sketch showing the pass between the F-16 and Partnair. |
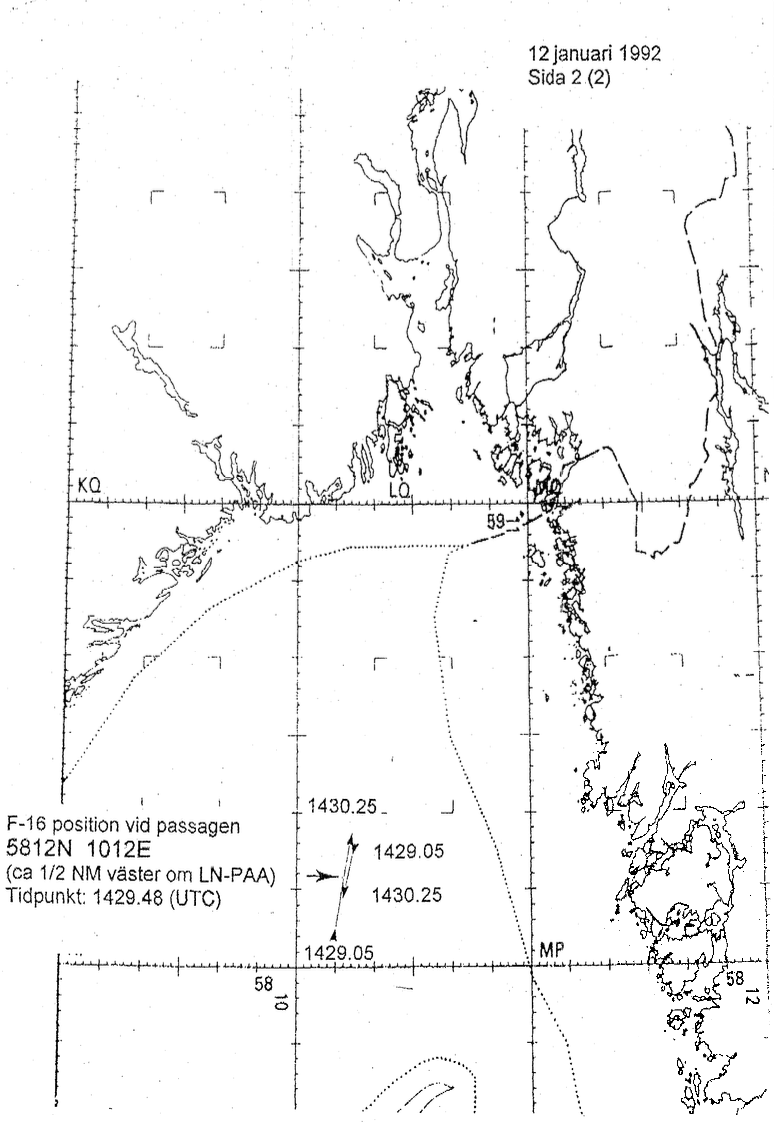
Gunnvall described that the F-16 and LN-PAA flew so close to each other that the radar points merged and became invisible on the image. Any heading corrections within the 80 seconds are not included in the calculations. The speed calculations will be incorrect because the straight-line distance between the endpoints is shorter than the distance the F-16 likely flew. An average speed over 80 seconds also cannot capture whether the F-16 was supersonic during parts of the time interval.
Swedish radar, pass between the F-16 and Partnair. |
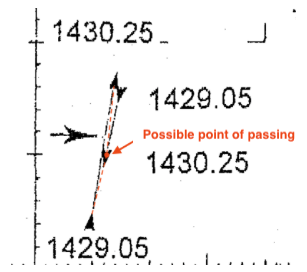
As described in the chapter on supersonic speed, the speed of sound at 25,000 feet altitude will be just above 601 knots, which corresponds to 309 m/s. The average speed of 300 m/s that Gunnvall calculated is only 30 km/h below the speed of sound. Given the uncertainty regarding atmospheric conditions and averaging over a large time interval, there is a high probability that the F-16 was flying at supersonic speed at the time of passing.
Speed Calculations
With obvious logical errors in both datasets, it is natural to verify the speed calculations. The radar system calculates the ground speed of the aircraft based on the distance between two registrations and the time interval between them. The radar operates with distances in "data miles" and speed in "data miles per hour" (1 data mile = 1.8288 km).
F-16 Speed Discrepancies
Speed between two points is calculated by finding the distance between the coordinates and then calculating speed based on the 12-second time interval.
1992 Dataset
Skagen 1992, F-16, sample data. |

Example (lines 11 and 12): The distance between (580736N, 100907E) and (580924N, 101013E) is 3.51 km. This gives 292.5 m/s (1,053 km/h), which corresponds to 575.8 DM/H. The speed logged is only 544.1 DM/H (995 km/h).
1990 Dataset
In the 1990 dataset, the position is given in X and Y position. This is the distance from the radar station to the aircraft. By using stereographic projection, with the radar station's position as the origin, the X and Y values can be converted to map coordinates. This conversion must be done to be able to plot the points on a map and calculate the distance between two points.
Skagen 1990, F-16, sample data. |

The decimal coordinates for line 11 are (58.1248762, 10.15325583) and (58.15539755, 10.17178854) for line 12. The distance between these points is 3.563 km. There are 12.1 seconds between the two measurements, and the speed is therefore 579.7 DM/H (294.5 m/s).
If one performs the corresponding calculation for lines 12 and 13, the speeds are 574.9 DM/H (292.0 m/s) and 613.6 DM/H (311.7 m/s).
For the F-16 aircraft, there is a significant discrepancy between the speeds in the dataset and the results obtained by calculating speed based on change of position over time. The deviation was between 6% and 13% for the lines in the example. For the entire dataset, the deviation varies between 1% and 53%.
Partnair Speed Discrepancies
If the radar system uses a different method for calculating speed that would produce such differences, this should also apply to data from the Partnair aircraft.
Skagen 1990, Partnair, sample 1. |

Converted to map coordinates, these points are (58.64339654094567, 10.470050392698258) and (58.63319645187729, 10.464800063415908) respectively. The distance between these points is 1.18 km. With a time difference of 12.1 seconds, the speed between the points was 97.5 m/s (351 km/h). This corresponds to a speed of 191.7 DM/H.
Skagen 1990, Partnair, sample 2. |

The corresponding speed calculation yields a speed of 198.5 DM/H.
The discrepancy in the speed data for the Partnair aircraft appears to be around 1–2%, based on these two samples. This indicates that the speed calculations are consistent for Partnair, but not for the F-16.
Supersonic Speed for the F-16
«The speed of sound (Mach 1) varies with altitude and temperature. If an aircraft is travelling at the speed of sound at sea-level then its speed will be 661 knots (760 miles per hour) or if it is travelling at the speed of sound at 30,000 feet then its speed will be 589 knots (677 miles per hour).
Aircraft speed is usually measured in knots which is a unit of speed equal to one nautical mile per hour. Fast military jets have their top speed listed as a Mach number with Mach 1 being the speed of sound, and Mach 2 is twice the speed of sound.
An aircraft that is travelling at supersonic speed is exceeding the speed of sound (Mach 1). Speeds greater than five times the speed of sound (Mach 5) are often referred to as hypersonic.» (The Speed Of Sound – Mach 1 – Supersonic, n.d.)
Based on the table on the aforementioned page, Mach 1 would be approximately 601 knots at 25,000 feet.
Table with Mach speeds at different altitudes. |
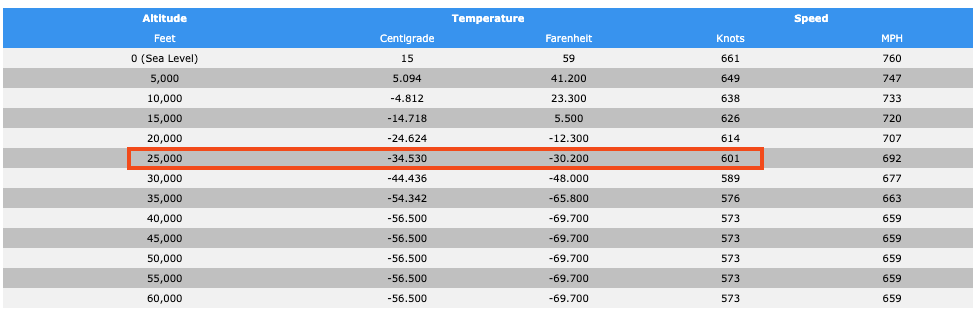
Using this speed, it is possible to calculate the F-16 aircraft's Mach number in connection with the pass of the Partnair aircraft. To find true airspeed, tailwind must be added to the ground speed. Before the pass, the F-16 was on a heading of approximately 015°. With 70 knots of wind from 260°, this would have given the F-16 a tailwind of 24 knots. Mach 1 then means a ground speed of 625 knots.
According to the dataset, the F-16 broke the sound barrier for the first time at 14:28:30 (634 knots, line 3 in the dataset), when it was located approximately 40 kilometres northwest of Skagen.
F-16, Mågerø, 634 knots at 14:28:30. |
F-16 Speed in the AWACS Video
In the AWACS video, the right turn is shown approximately 77 seconds before the aircraft meet:
«The track from the south, 4310, is heading 034 altitude 24100, speed of 585 knots.» (18:45 in the video)
585 knots is approximately 50 knots higher than the speeds in the Skagen dataset, but corresponds more closely with what has been calculated based on position changes. In other words, there is a discrepancy between the AWACS-registered speed and the Skagen dataset.
The Accident Report's Radar Sketch
By comparing the sketch in the accident report with the various datasets, one can see that the closest dataset is the 1992 version from Skagen. Given that the new versions contain corrections where there are obvious errors, a logical explanation is that the new versions were produced because it was not possible to create a sketch without correcting the errors. Had the original data been used, the errors would have been very clearly apparent.
(The Accident Report, 1993, Figure 8) | F-16 and Partnair, Skagen, 1992. |
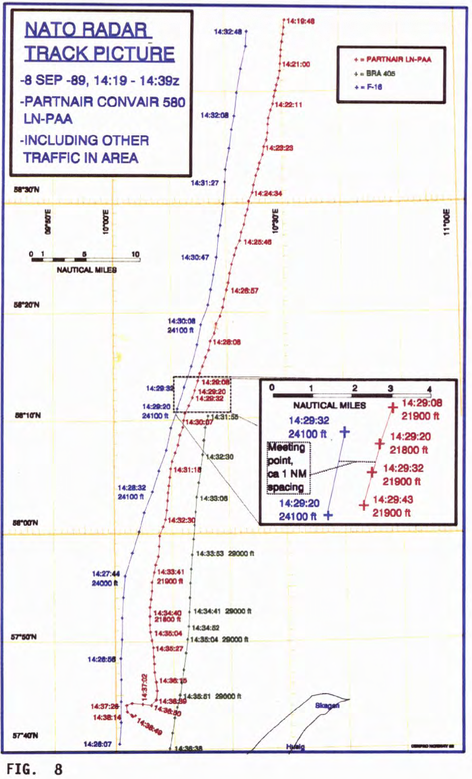
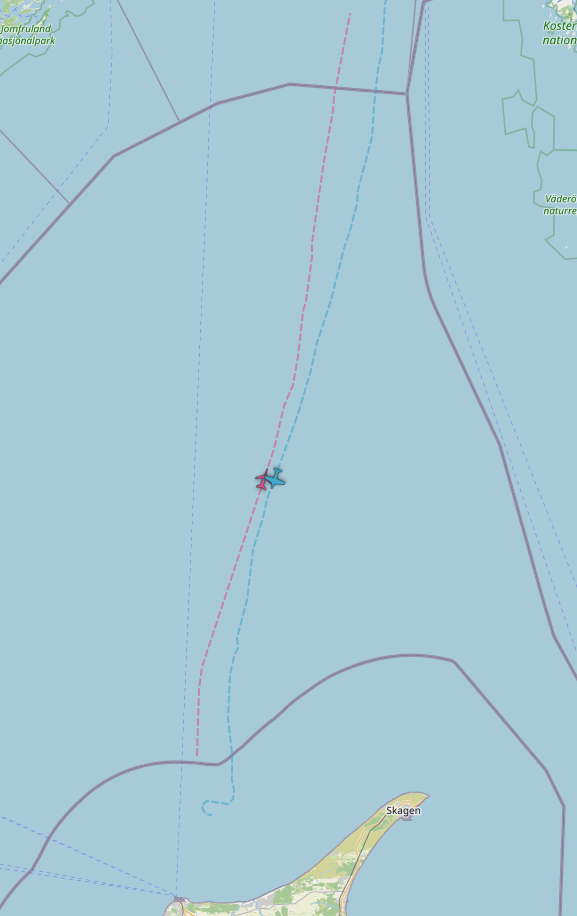
When producing a radar sketch from a few divergent datasets, one cannot make a selective selection and correct the data by hand. This is not a scientific method. If one truly wished to establish with a high degree of certainty where the aircraft were, one would have had to compare the data from all sources, remove the noise, and then be left with a radar track with relatively high precision.
All NATO Radar Data Plotted
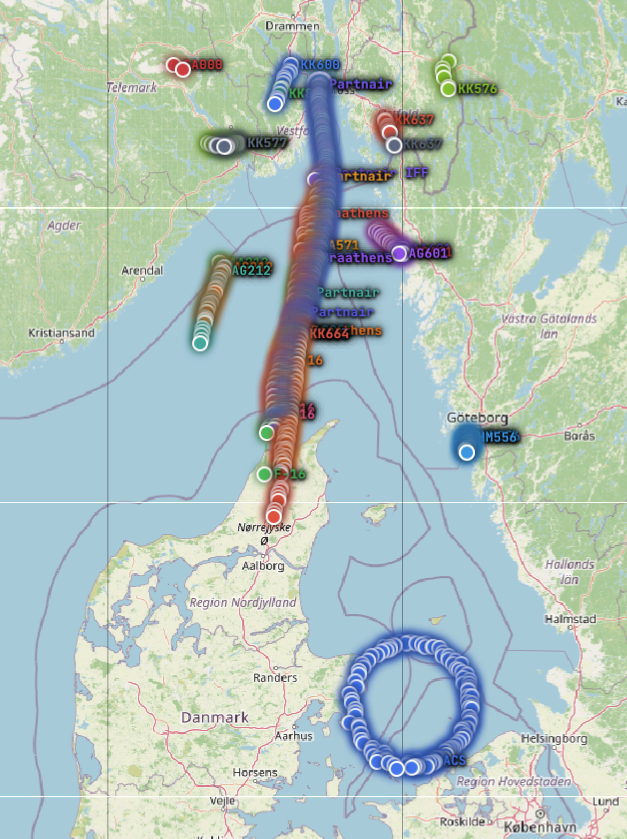
If one plots all the radar data that NATO delivered, the problems with the datasets become apparent. The datasets form 10 different tracks for the 2 aircraft. The AWACS tracks lie approximately 3 kilometres west of the tracks from Skagen and Mågerø. The horizontal spread is approaching 2 nautical miles.
F-16 and Partnair, Skagen, Mågerø, AWACS. |
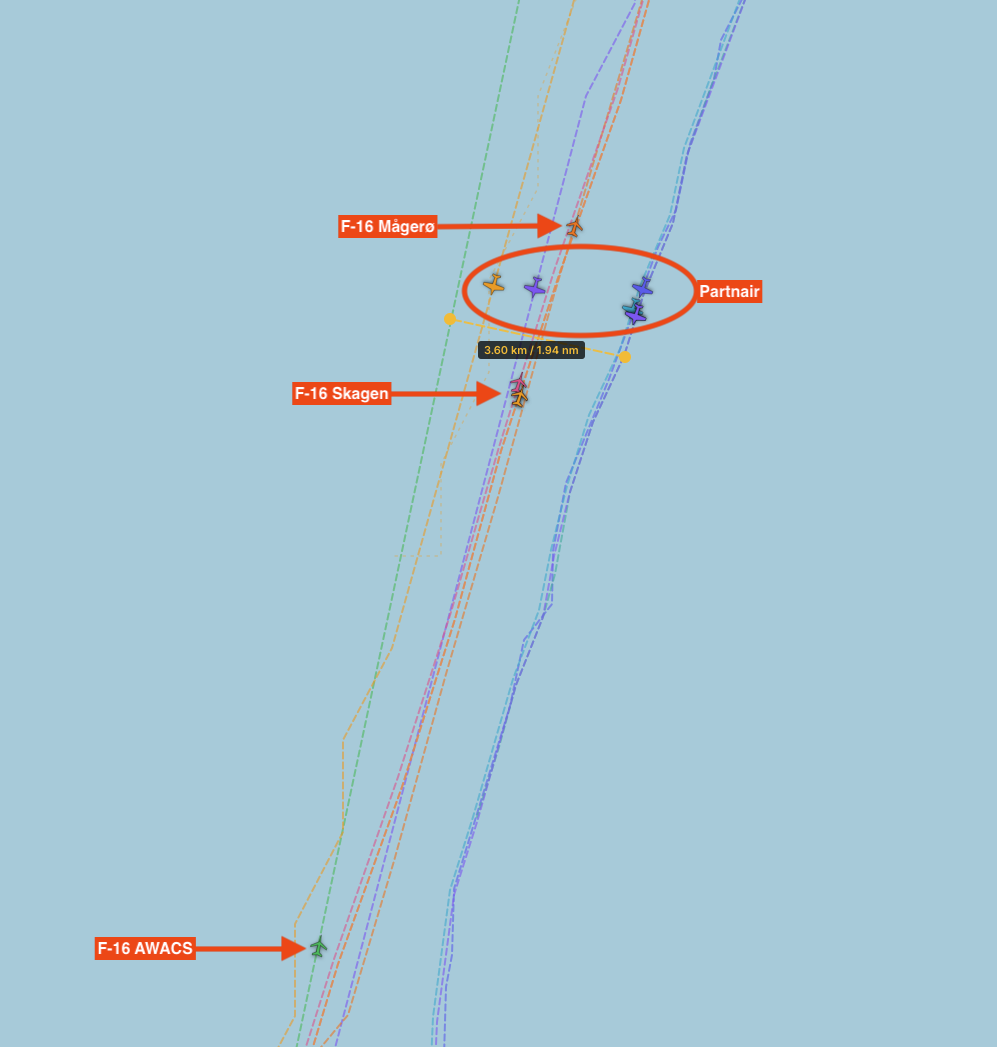
In the datasets, there is primarily data for Partnair, the F-16, and Braathens, but there are also other registrations. No position data has been presented for the AWACS aircraft, but the track can be plotted by reversing the position plotting: using the F-16 and Partnair aircraft positions as the starting point, the AWACS aircraft's position can be calculated using the distance and azimuth given in the AWACS dataset.
All NATO radar sources, with the AWACS aircraft's track (circle at bottom). |
Discussion
The radar data is consistently of low quality with obvious errors and few registrations. Swedish radar has stored data at such low resolution (40–80 second intervals) and with analogue interpretation of position data from a screen that they in practice cannot be used to establish exactly where the aircraft were in relation to each other. It is nevertheless interesting that the speed calculations indicate a far higher speed than that stated in the Skagen data, and that the distance between the tracks is also markedly less than what the NATO radars show.
All the errors in the radar data appear to be the result of human involvement. The errors with time differences for the F-16 provide a clear indication that multiple simulations have been carried out and data has been stitched together. In combination with human errors, this has produced datasets with clear indications of manipulation.
The timestamps on the printouts indicate that radar data from Skagen, Mågerø, and AWACS was produced a few days after the accident. The time pressure must have been enormous if an alternative reality was to be produced, and it is likely this that one sees traces of through the many human-made errors.
When radar data has been clearly manipulated, it cannot be trusted. A selection of radar data, even if it shows a real situation, is not reliable when certain sequences have been removed—as for the F-16 in the AWACS data, where only 9 points have been released and the pass between the aircraft has been removed. Nor is it possible to trust the altitude data in any of the datasets, since there are no objective sources, and the altitude data cannot be verified from other columns.
That Partnair departed from Fornebu and crashed north of Hirtshals, and that the F-16 flew from Aalborg to Rygge, are known facts. Exactly where the aircraft were between these points cannot be established based on the radar data that has been made available. It is therefore not possible to establish, with the accuracy needed to determine whether a supersonic shock wave damaged the Partnair aircraft, where the aircraft were in relation to each other.
It is natural to ask why the radar data is full of obvious errors if someone deliberately altered it. The most plausible explanation is that the datasets were produced under intense time pressure, probably with tools that were not suited for the purpose. The datasets bear the hallmarks of having been assembled from multiple sources and simulations, and it is this that one sees traces of through the errors.