Radar Data
Radar data is essential in the investigation of aircraft accidents. In the Partnair case, the radar data has been decisive for the accident investigation board's conclusions and for the outcome of the subsequent lawsuits between Partnair and the state.
Despite the fact that, in theory, large quantities of radar data should have been available from multiple radar stations, surprisingly little data exists. The radar data that has been presented bears the hallmarks of post-processing, contains inexplicable errors and contradictory information, and has been delivered in multiple versions with mutual discrepancies. It is not possible to use the available radar data to prove exactly how close the aircraft were to each other, but it is possible to establish that the data has been altered.
Background
There are primarily two aspects that radar data can help illuminate:
- When the Partnair aircraft began to deviate from its heading, cruise speed, and altitude
- Whether other aircraft in the area were close enough to have been able to affect the Partnair aircraft
The accident investigation board concluded that everything appeared normal almost right up until the Partnair aircraft disappeared from radar, and that no other aircraft were close enough to have been a contributing factor. In subsequent lawsuits between Partnair and the state, regarding whether the F-16 caused the accident, the state prevailed based on the radar data evidence.
That the radar data is correct and has sufficient resolution are fundamental premises for being able to use radar data as evidence.
Radar Technology
The principle behind primary radar is relatively simple: a radio signal is transmitted and an antenna receives the reflected signal. By measuring the time from when the signal is transmitted until the reflection is received, the distance can be calculated. The radar head rotates continuously and registers the bearing (azimuth) and range to the aircraft.
It is not possible to determine exact altitude using primary radar. This is the reason civilian aviation primarily uses secondary surveillance radar (SSR). This radar transmits a signal that is received by the transponder in the aircraft, and the transponder responds with information in return. In 1989, Mode A (identifier/squawk code) and Mode C (pressure altitude) were in use. In addition to bearing and range, the secondary radar thus provided a four-digit ID and precise altitude measurement from the individual aircraft's transponder.
For military purposes, one naturally cannot rely on information transmitted from a transponder in an aircraft, and therefore there is far more extensive use of primary radar for military purposes than in the civilian context. A 3D radar is a primary radar that scans the sky with a narrow radar beam so that the radar can also calculate the aircraft's altitude. The Partnair aircraft was within the coverage area of the Armed Forces' 3D radar at Eigersund, but no data from this radar has been presented in this case.
Stereographic Projection
Position data from the radar sources in this case is based on stereographic projection. In order to plot the positions on a map or calculate speed, the data points must be converted to latitude and longitude. The projection algorithm takes the radar station's coordinates as its centre, and the positions in the raw data are given in "data miles," which are then converted to metres before being transformed into geographic coordinates.
NATINADS
«The NATO Integrated Air Defense System» (NATINADS) is a network of radar stations and control centres. Mågerø and Skagen radar were part of this network. Neråsen wrote on 13 September, in a letter regarding radar data from Mågerø radar:
«Please note that all data is based on information that is automatically transferred from Danish radar to Lstn Måkerøy.» (Neråsen, 1989, p. 1)
In practice, this means that radar data from Skagen and Mågerø may consist of information from radar stations other than solely the station from which the printout originates.
Radar Sources
«HSL has had access to information from the following sources: Oslo ACC radar, the military radar at Måkerøy, the military radar at Skagen in Jutland, radar data from Skagen transferred to Måkerøy, a NATO AWACS aircraft circling north of Zealand approximately 120 NM (220 km) from the accident site, two radar stations in the Swedish Armed Forces, the approach radar at Aalborg airport, Copenhagen ACC radar.» (The Accident Report, 1993, p. 78)
To construct a picture of where the Partnair aircraft and other aircraft were moving, the accident investigation board has had multiple sources to draw upon. The accident investigation board early in the process dismissed the possibility that the F-16 may have influenced the sequence of events, and thus had no need to prove that the F-16 had flown close to the Partnair aircraft.
The radar data that has been relied upon provides no evidence of a close pass, but neither does it provide evidence that a close pass did not take place. The data from the NATO radars is apparently unreliable and incomplete. From Swedish military radar, and civilian radars in Norway, Sweden, and Denmark, no data is available that can be used to verify the accident investigation board's conclusions.
Actual radar data that can be plotted on a map comes from only three sources: AWACS, Skagen, and Mågerø. The AWACS data for the F-16 contains only 9 coordinates, and none of them shows the point of passing. The Skagen data has been delivered in two different versions with mutual discrepancies. The Mågerø data is based on a simulation.
Radar source | Type of data | Comment | Value as evidence |
Oslo ACC radar | Unknown | Not discussed in the accident report | Unknown |
Måkerøy | Data dump | Simulated data, which does not show the actual situation | None: not real data |
Skagen | Data dump | Data dump with many errors, apparently showing physically impossible situations | None: not real data |
Skagen transferred to Måkerøy | Data dump | Same data as Skagen, thus not a separate data source | None: not real data |
AWACS | Data dump and sketches | 9 points for the F-16, but no data points at the time of passing | Low: too little data |
Swedish radar | Sketches and descriptions of recordings from radar screen | Only 1 of 2 sketches is appended to the report. One sketch shows parts from the Partnair aircraft. | Low: missing base data |
Aalborg radar | Report with description | Observation of a stationary object 41 NM north of Aalborg | None: missing data |
Copenhagen ACC radar | Description | The report refers to "something" being seen 40 NM north of Aalborg | None: missing data |
Timeline of Radar Data Delivery
Despite the fact that the Armed Forces knew that the F-16 passed the Partnair aircraft, and had Norwegian, Danish, and American radar data showing the pass, the Armed Forces initially denied that there was any aircraft other than a Braathens in the area. Only three weeks after the accident did the Armed Forces deliver radar data showing the F-16 in the area.
Five months after the accident, the Armed Forces delivered a complete radar dataset for the Partnair aircraft, while there are only fragments of radar data for the F-16. None of the datasets from Mågerø or Skagen can be direct data dumps from the radar systems; they bear clear signs of having been post-processed.
Two and a half years later, when the accident investigation board was in the process of finalising the report, the Armed Forces delivered a new version of the radar data. This dataset also contains major errors and corresponds neither with the first dataset nor with reality.
Date | From | To | |
13.09.1989 | Richard Nielsen, Air Traffic Service Aalborg Airport | The accident investigation board | Observation of a stationary object above the accident site between 14:55 and 15:20. |
13.09.1989 | Bjørn Neråsen | The accident investigation board | «Hereby transmitted are all data that the Air Force Station Måkerøy can contribute regarding the above-mentioned accident.» (Neråsen, 1989, p. 1). Every third plot from the simulated Mågerø data is appended to the letter. |
19.09.1989 | Nato Airborne Early Warning Force, Geilenkirchen, NATO Air Base | Kontroll og Varslingsgruppen ATEN: O-afdelingen Denmark | AWACS data plot of the F-16, Partnair, and Braathens. (The appended dataset consists of 9 points for the F-16, and is missing approximately 3.5 minutes around the time of the pass.) |
19.09.1989 | Bjørn Neråsen | The accident investigation board | «In accordance with the agreement between Rygnestad, the Accident Investigation Board, and Johannessen, Lstn Måkerøy, hereby transmitted are data on other aircraft movements in the area near the time of the accident. As the appendix shows, only one – 1 – aircraft movement in the vicinity of the accident site has been registered. It is Braathens SAFE BRA 405 from ENFB to EKBI.» (Neråsen, 1989, p. 1) |
22.09.1989 | The Civil Aviation Authority | The accident investigation board | «Hereby transmitted is an audio tape copy of the conversation between Oslo ACC and M5007 on 8.9.89.» ("Letter Regarding Audio Tape Copy," 1989, p. 1) |
26.09.1989 | Danish accident investigation board | The accident investigation board | Barvik collects printout of radar data from Skagen radar at the accident investigation board in Denmark. |
27.09.1989 | Bjørn Neråsen | The accident investigation board | «Hereby transmitted is the plotted track for PARTNAIR's aircraft and the F-16 on the opposite heading.» (Neråsen, 1989, p. 1) |
28.09.1989 | F-16 pilot | The accident investigation board | «At approximately 1430Z, I detected an aircraft on the radar coming straight towards me—at approximately the same altitude.» (Norwegian 5007, 1989, p. 1) |
11.10.1989 | Olle Forssberg | The accident investigation board | Sketches produced based on radar data from military radar stations in Sweden. |
07.02.1990 | Sigve Barvik | The accident investigation board | Dataset from Måkerøy and Skagen. |
19.08.1992 | Sigve Barvik | The accident investigation board | New version of dataset from Skagen radar. |
Data Volume and Quality
Potential Data Volume
At both Mågerø and Skagen, there were three radar heads: two 2D radars and one height-finding radar. Only radar data from the 2D radars is available, not from the height-finding radar. The rotation speed of the Skagen radar was 5 revolutions per minute. Mågerø's radar heads rotated 6 times per minute. The AWACS aircraft's radar head rotated 6 times per minute.
If one were to draw upon the raw data from Skagen, Mågerø, and AWACS, there would have been approximately 980 data points for Partnair and 560 for the F-16 from the five radar heads. In order to study deviations and establish the precision of the measurements, it is important to have as much data as possible. The five radar heads collectively registered the aircraft 28 times per minute. Even when studying only a small segment of the flight, there should potentially be very good radar data coverage for both the F-16 and the Partnair aircraft.
Aircraft | Flight time | Skagen x 2 | Mågerø x 2 | AWACS | Total |
Partnair | 35 min | 350 | 420 | 210 | 980 |
F-16 | 20 min | 200 | 240 | 120 | 560 |
Available Data Volume
Raw data is available from Skagen, Mågerø, and AWACS. The total data volume is very small relative to the number of registrations the radars made. For Skagen and Mågerø, the raw data covers only a period of five minutes. In other words, it is not possible to use raw data to verify all the post-processed radar data documents, since these cover a larger time span.
Fly | Skagen | Mågerø | AWACS | Total |
Partnair | 23 | 21 | 69 | 113 |
F-16 | 24 | 19 | 9 | 52 |
Braathens | 13 | 16 | 66 | 95 |
Raw Data Versus Post-Processed Data
Radar data exists in two types of documents. One type appears to be printouts from the tracker in the radar system, while the other appears to have been post-processed by humans. In 1989, it was not as straightforward to exchange data between systems as we are accustomed to today. It is therefore reasonable to assume that the transfer of data from the radar system to a word processor was based on a manual process.
While with machine-based, digital data transfer one would expect zero errors, there is a high probability of typographical errors where humans have manually transferred data from one system to another.
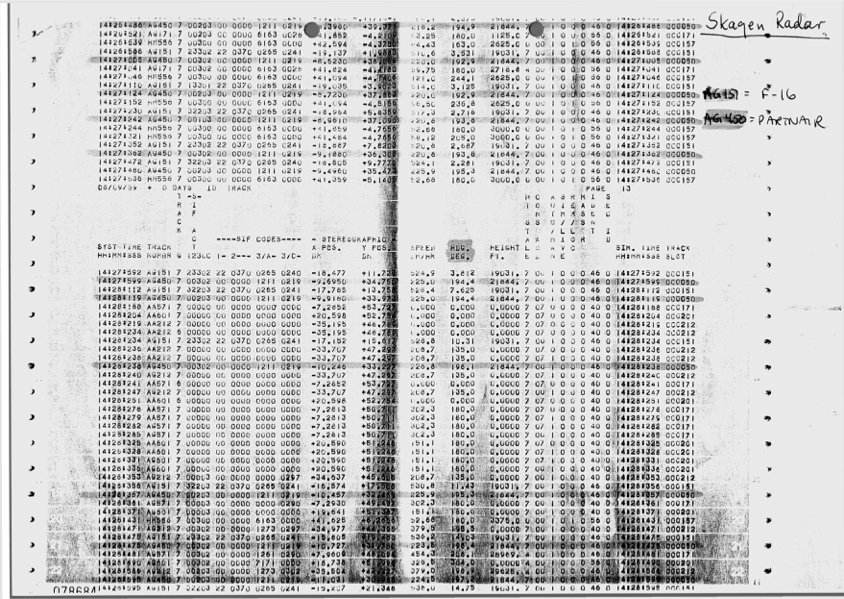
Example of raw data from Skagen radar. |
Example of post-processed radar data for the F-16. |
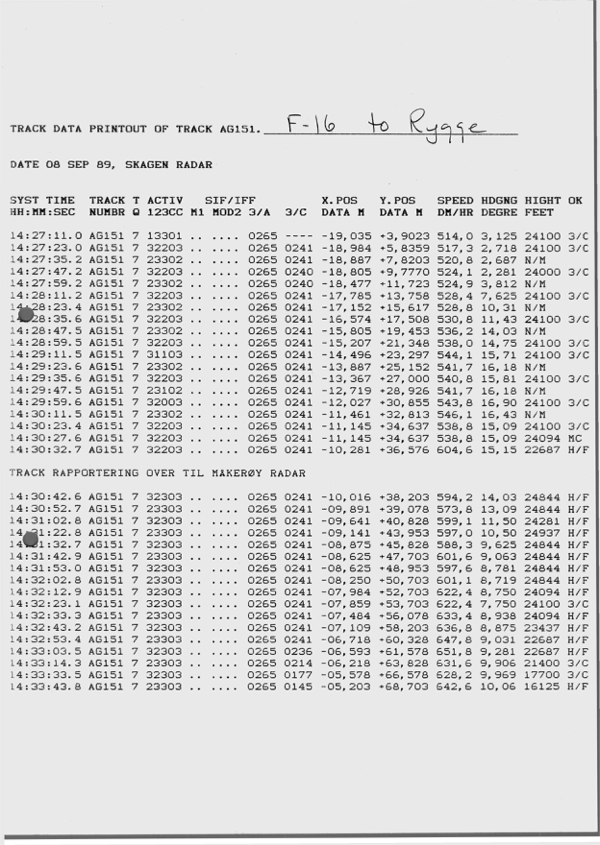
The raw data from the radar systems contains data for multiple aircraft. The position data is based on stereographic projection. In the documents with the post-processed radar data, data for the different aircraft has been separated, and position data has been converted to latitude and longitude. There are also instances where radar data from different radar stations has been merged into one document.
It is natural to assume that the post-processed radar data is based on the raw data printouts, and that they therefore contain exactly the same data. The raw data contains information from both primary and secondary radar, and there is no information suggesting that other radar sources were used as the basis for the post-processed documents. All discrepancies between the raw data and the post-processed radar data are therefore important, as they may indicate transcription errors or that unknown radar sources have been used.
Identifying Radar Sources in the Raw Data
Based on the different rotation speeds of the radars, Mågerø radar data can be identified by the fact that the radar heads registered the aircraft every 10 seconds. Skagen's radar heads took 12 seconds per revolution.
The printouts from the radar systems at Skagen and Mågerø have the same format. In a cover letter accompanying post-processed radar data, there is a description of what the various columns in the data printouts mean, but not all columns are described.
(Barvik, 1992, p. 7)
Column title | Column description | Comment |
SYST TIME | Timestamp | |
TRACK NUMBER | Track identifier | |
TRACK Q | Indication of how recently the track was updated | |
AIF ACT 123CC | Quality indicator for how old the secondary radar data is | 3 = fresh data, d0 = old data. The middle of the 5 digits concerns "mode 3/A and 3/C" |
SIF CODES | Data received from the transponder in the aircraft | Mode 1 and 2 are for military aircraft only. Mode 3/A (ident/squawk) and 3/C (pressure altitude) are also used by civilian aircraft. |
X POS. / Y POS. | Position, stereographically projected | The position is calculated using the relevant radar station's position as origin, regardless of which radar station the information comes from. |
SPEED DM/HR | Speed in "data miles" per hour | 1 DM = 6,000 feet. DM/1.012 = knots |
HDG. DEG. | Heading between data points | The radar system calculates the heading based on the change in position. The values may have been "smoothed" by the radar system by using averages from multiple measurements. |
HEIGHT FT. | Altitude in feet | |
HT STALE | Indication of how recently the altitude was measured | 0 = updated last scan, 7 is the highest value, indicating a long time since the data was updated |
CONS ADD | Unknown meaning | |
AUTO/MAN | Likely: binary value for "automatic" versus "manual." 0=auto, 1=man | |
SIM/LIVE | Likely: binary value for "simulation" versus "live." 0=sim, 1=live | |
REM/LOC | Likely: binary value for "remote" versus "local." 0=remote, 1=local | |
MASS R | Unknown meaning | |
IDENT | Unknown meaning | |
SEC ID | Unknown meaning | |
SIM. TIME | Simulerings-tidspunkt | In the dataset, this always has the same value as system time |
TRACK SLOT | Likely numeric track number in the local tracker |
Of particular interest are the binary values (0/1) that describe where the data comes from.
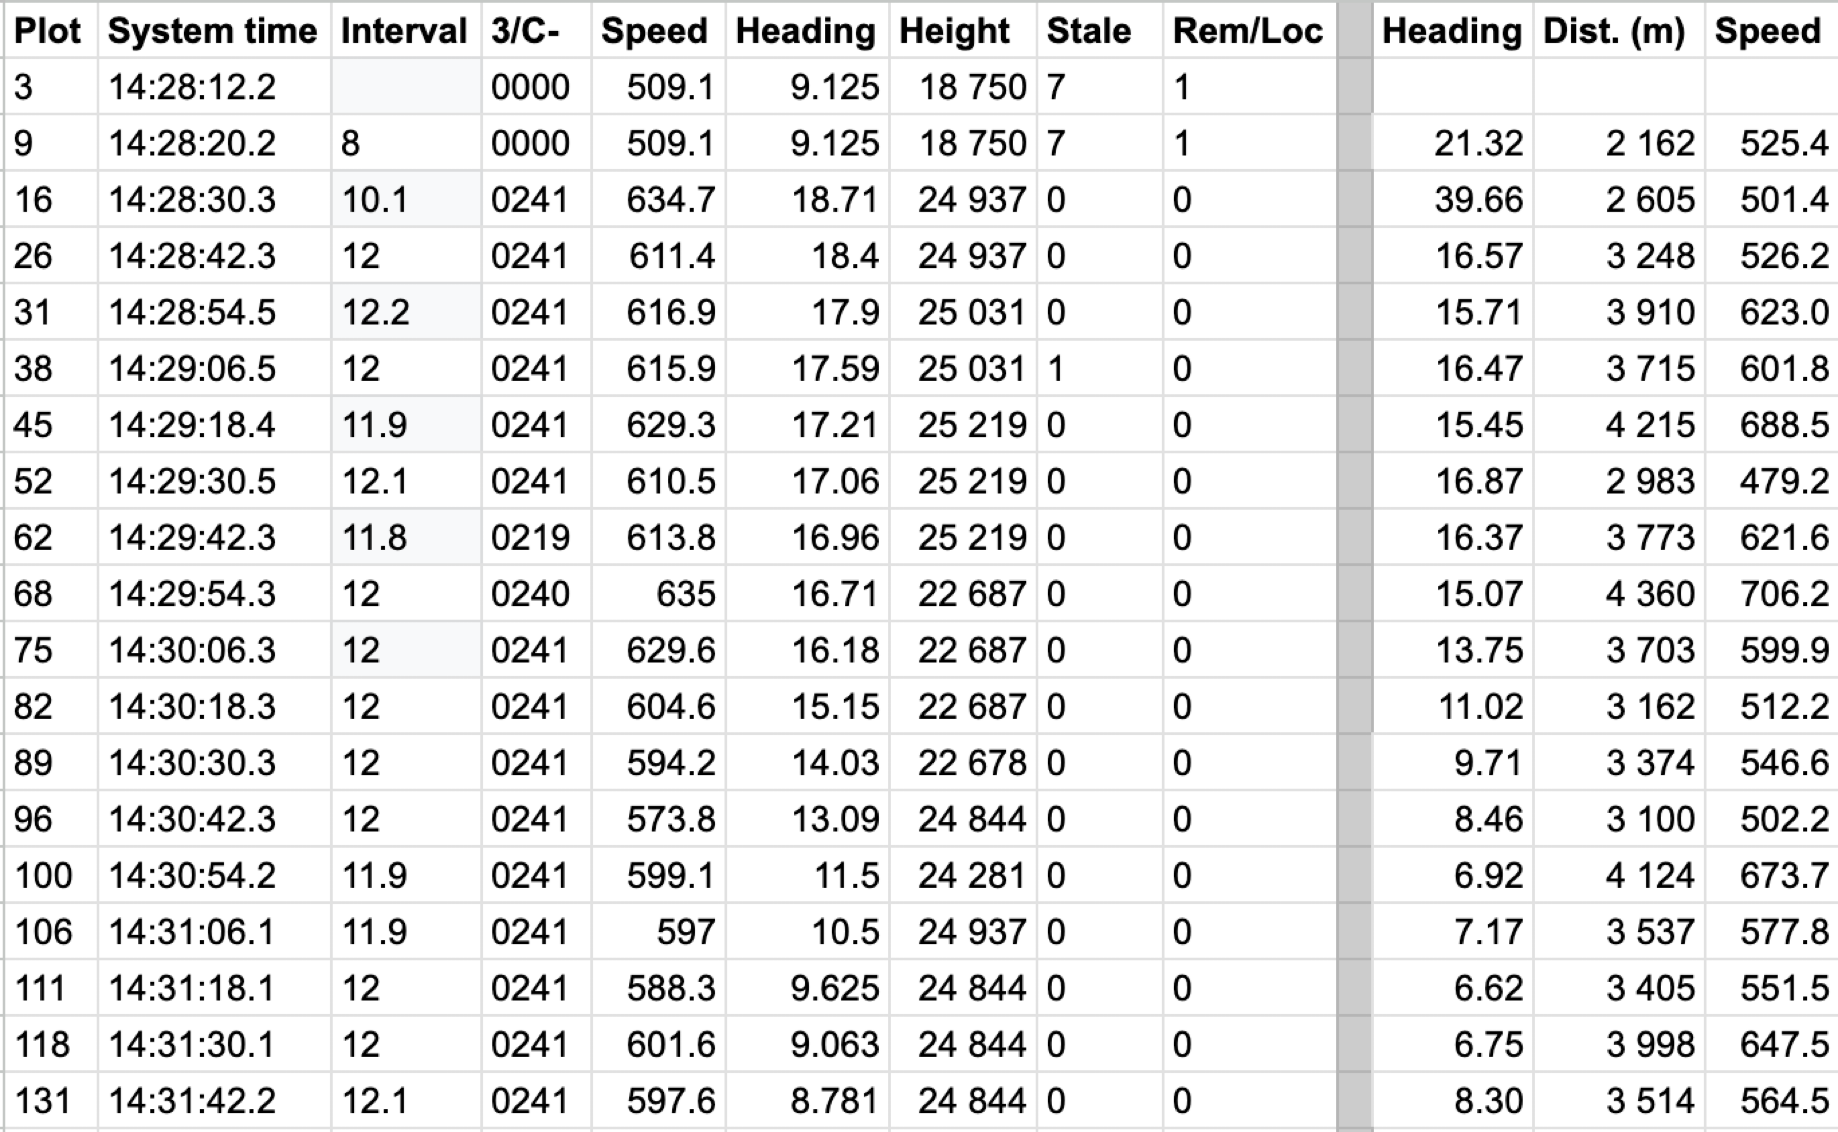
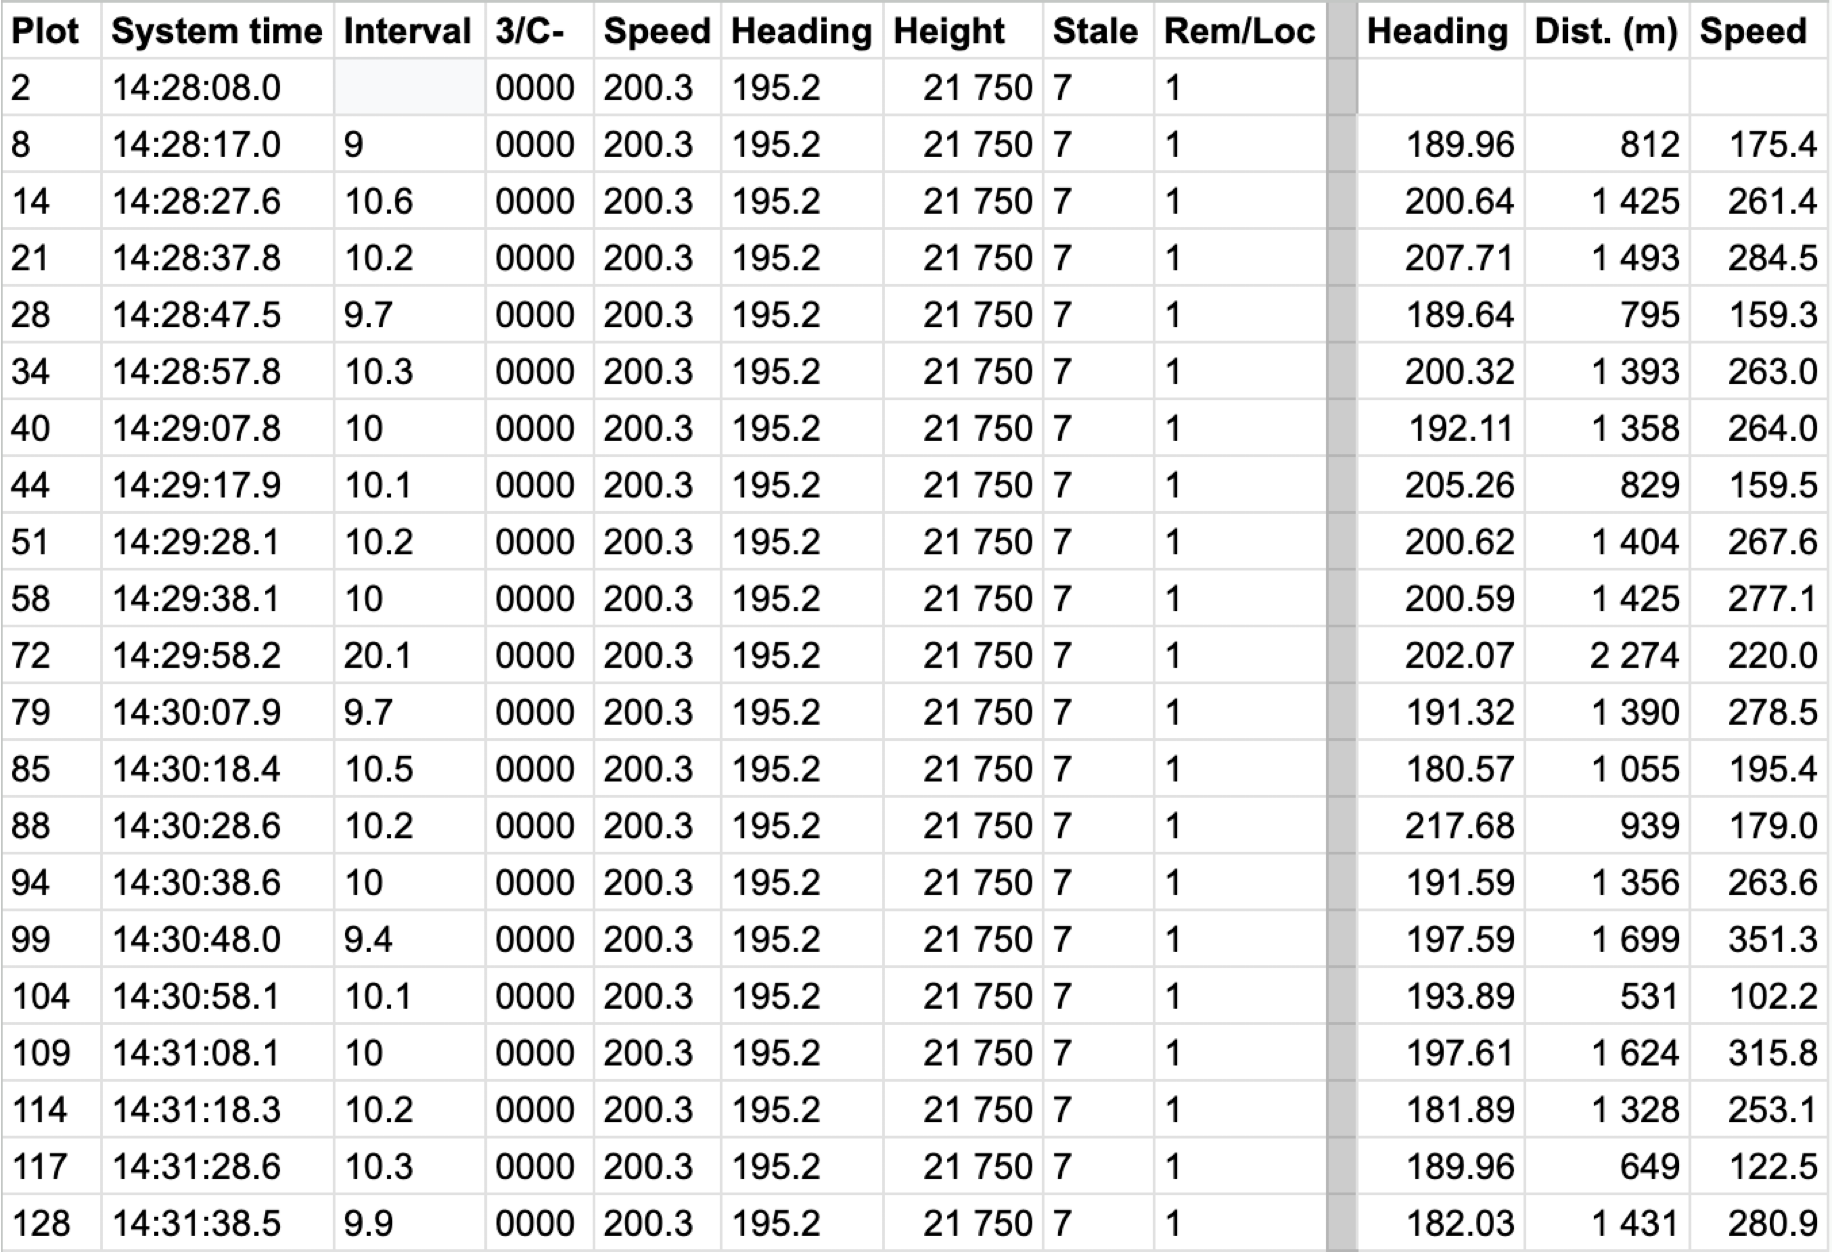
By studying the raw data from Mågerø, one can see that data at 10-second intervals is marked with "1" in the "rem/loc" column, which indicates that remote=0 and local=1. It is reasonable to assume that the other binary columns, "auto/man" and "sim/live," are coded in the same way. Since radar data was distributed through NATO's NATINADS network, there is a need to distinguish data registered by the local radar station from data that came from another station.
Example from the Mågerø data showing the Partnair aircraft at 10-second intervals. |
For the F-16, the Mågerø data appears to consist of two measurements made by Mågerø radar, before the interval changes to 12 seconds and the rem/loc value changes from 1 to 0. This indicates that the radar data for the F-16 comes from a radar station other than Mågerø.
Example from the Mågerø data showing the F-16 with changing intervals and rem/loc values. |